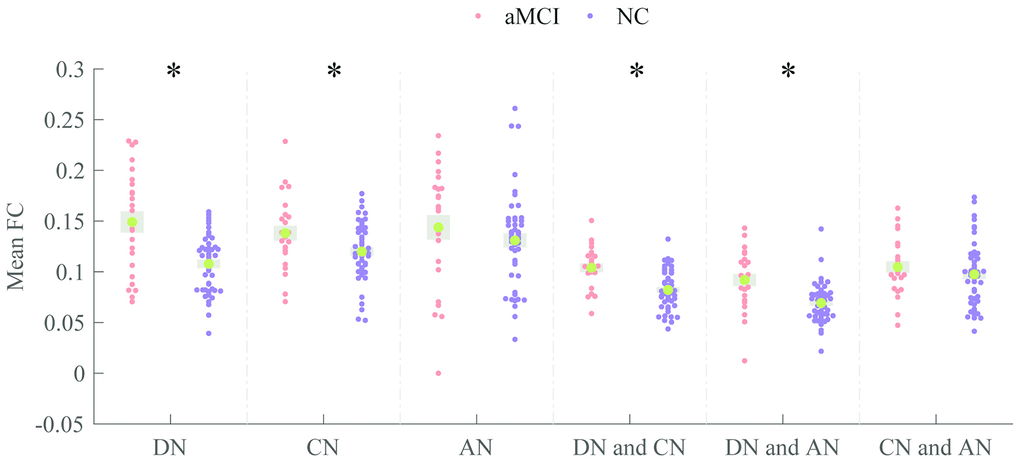
Figure 2.Comparisons of mean FC within- and internetwork. Patients and the normal persons are colored in Indian red and dark orchid, respectively. * P < 0.05 (uncorrected).
Figure 2 — Increased intrinsic default-mode network activity as a compensatory mechanism in aMCI: a resting-state functional connectivity MRI study | Aging