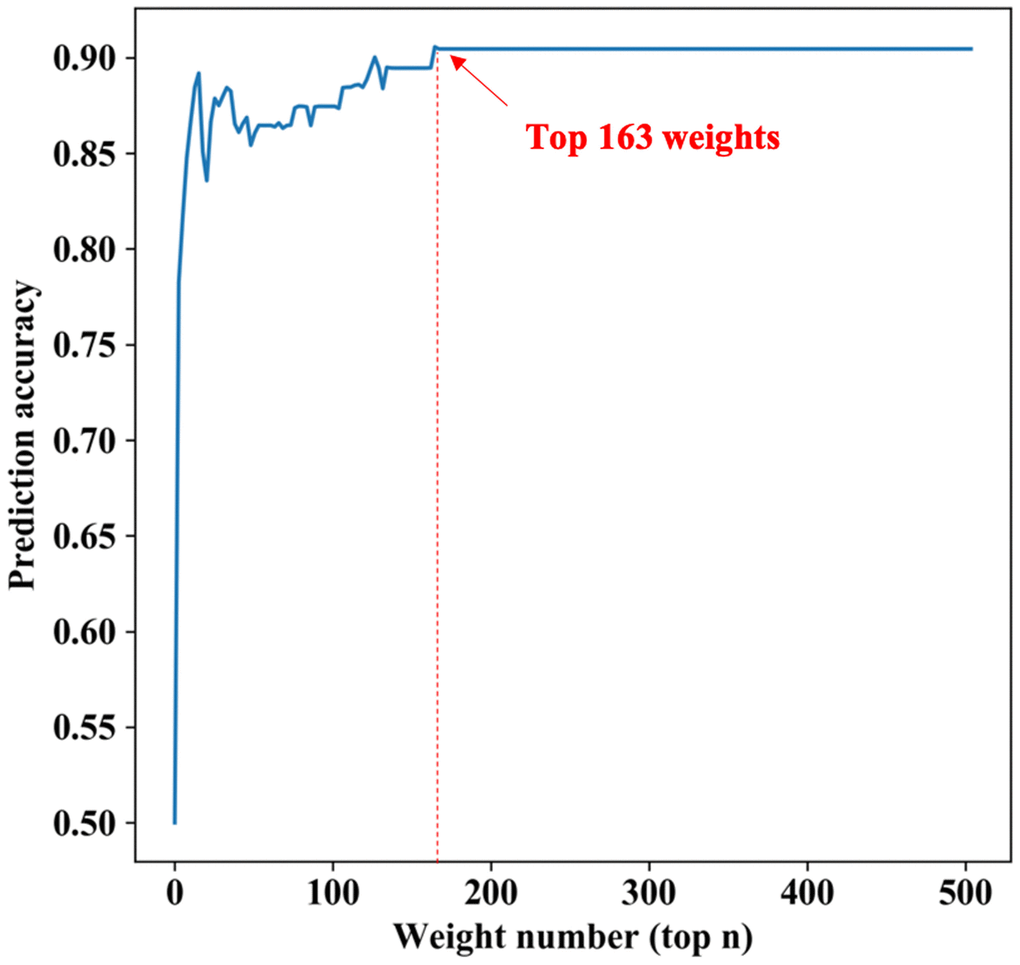
Figure 2.The relationship between the predicted results and the number of weights. The horizontal axis represents the largest top n weight parameters, the longitudinal axis represents the prediction accuracy under these parameters. At the beginning of the curve, with the increase of the weight number, the prediction accuracy increases gradually. However, when the largest top parameters number reaches 163 (about the top 6%), the prediction accuracy has the maximum and remains unchanged after that.