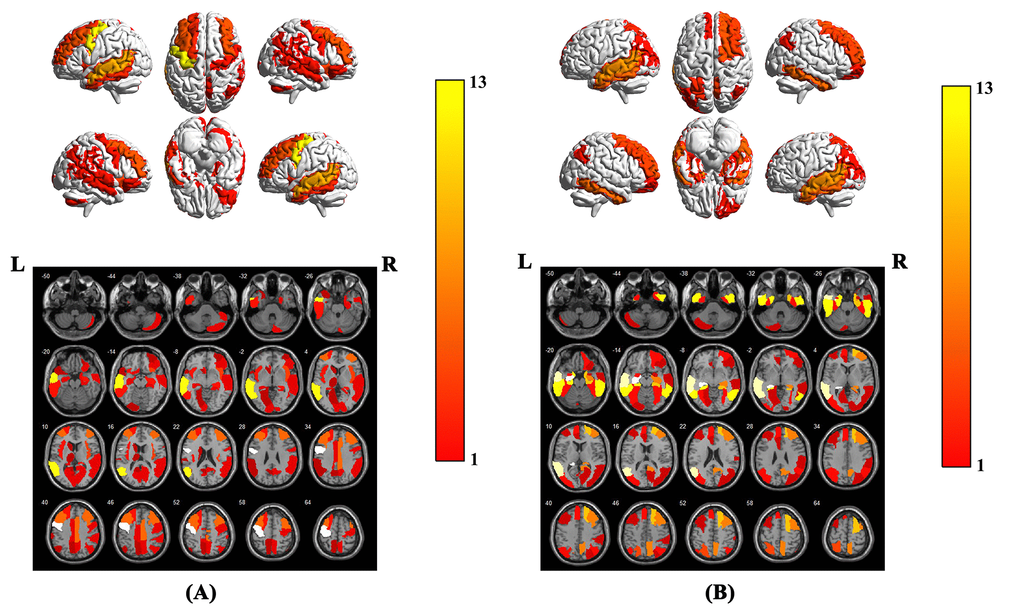
Figure 3.Brain region weight map based on AAL116 template, (A) represents the brain regions that have the greatest impact on the classification between AD patients and NCs when using the model parameters of this experiment on our in-house dataset, (B) represents the brain regions that have the greatest impact on the classification between AD patients and NCs. The weight value of each brain region is based on the average of the weight values in the brain region. The color bar represents the average weight value in each brain region, the larger the weight value of the model, the warmer the color in the graph.