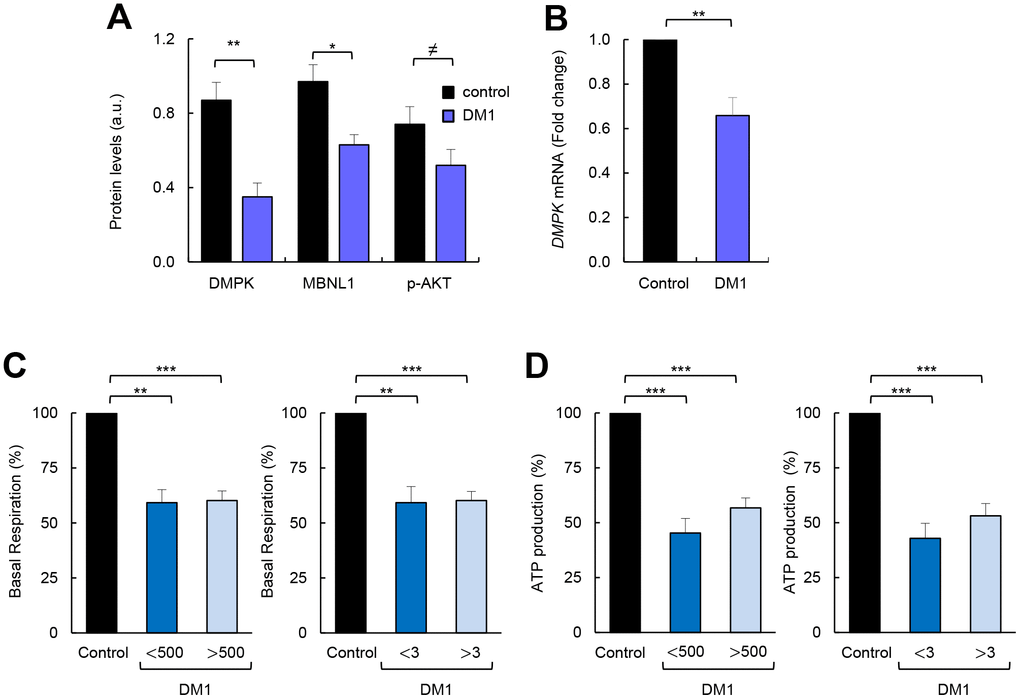
Figure 2.Correlation between impaired metabolism and markers of disease pathophysiology. (A) Quantification of protein levels shown in Figure 1F (n=4). (B) mRNA levels of DMPK in DM1 fibroblasts (n=7) and controls (n=3). (C) Basal respiration levels in controls (n=3) and DM1 fibroblasts stratified by CTG expansion in <500 (n=4) and >500 (n=3) (left) and MIRS scale in <3 (n=2) and >3 n=5 (right). (D) ATP production levels using the same stratification.