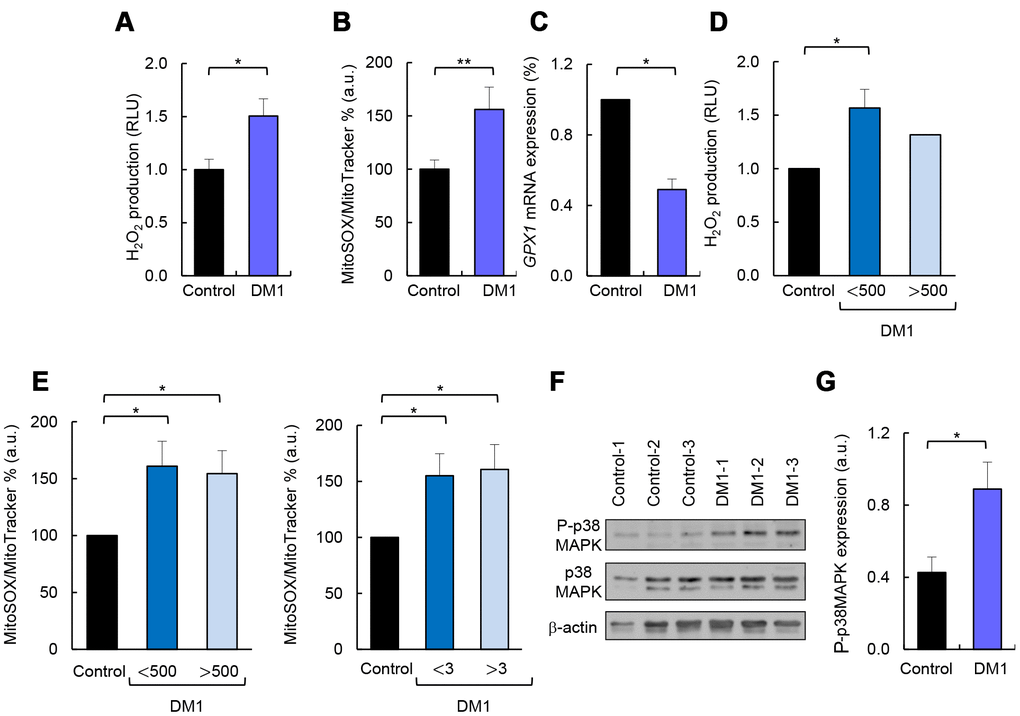
Figure 5.DM1-derived fibroblasts present accumulation of ROS and p38MAPK activation. (A) Luminescence signal proportional to H2O2 production in DM1 (n=4) and control fibroblasts (n=3). (B) Medium fluorescence intensity of MitoSOX+ values normalized to mean fluorescence of MitoTracker values in controls (n=3) and DM1 (n=5). (C) GPX1 mRNA levels in DM1 and control fibroblasts (n≥2). (D) Luminescence signal proportional to H2O2 production in controls (n=3) and DM1 fibroblasts stratified by CTG expansion in <500 CTG (n=3) and >500 CTG (n=1). (E) Medium fluorescence intensity of MitoTracker Red FM in controls (n=3) and DM1 stratified by CTG expansion in <500 (n=3) and >500 (n=2) (left) and MIRS scale in <3 (n=2) and >3 (n=3) (right). (F, G) Representative immunoblot and quantification of P-p38MAPK and p38MAPK protein levels in DM1 and control fibroblasts (n=3).