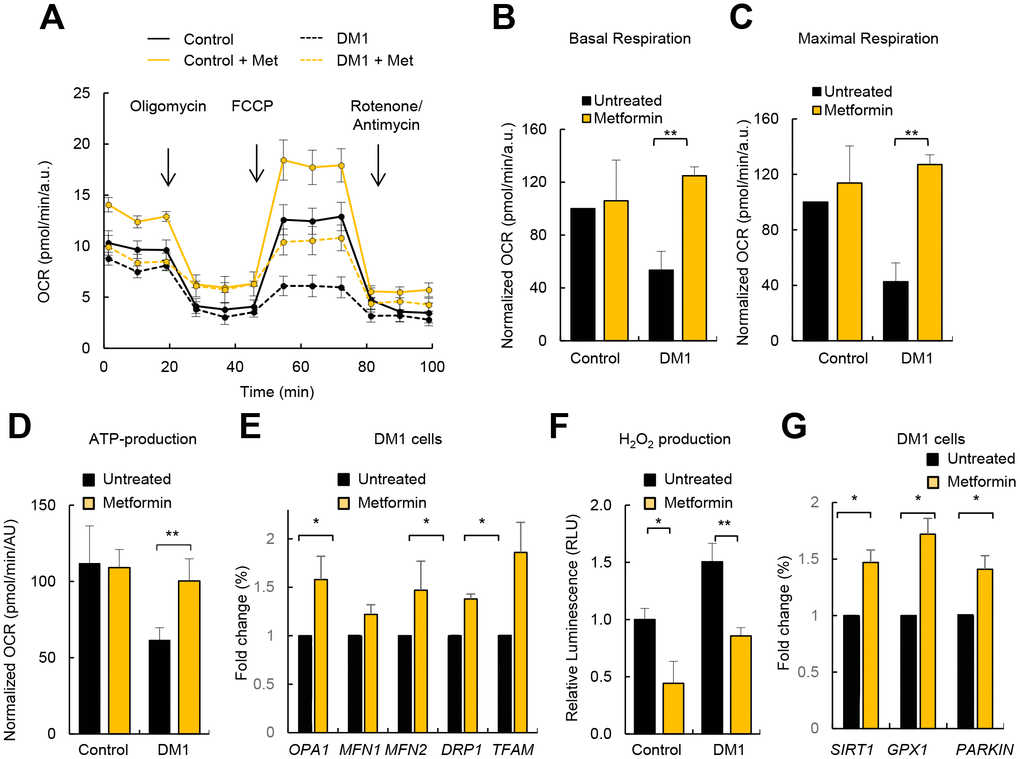
Figure 6.Metformin restores OXPHOS activity and ROS production in DM1 fibroblasts. (A) Representative kinetic normalized OCR response in DM1 (n=6) and control fibroblasts (n=3) after treatment with 1 μM of metformin for 72 h. DM1 and control fibroblasts were plated at 5.000 cells/well 24 hours prior to the assay. A representative experiment out of 3 is shown. (B–D) Quantification of mitochondrial basal respiration, maximal respiration, and ATP production respectively after treatment with 1 μM of metformin for 72 h of controls (n=3) and DM1 fibroblasts (n=6). (E) mRNA levels of OPA1, MFN1, MFN2, DRP1 and TFAM after treatment with 1 μM of metformin for 72 h (n≥2). (F) H2O2 production after treatment with 1 μM of metformin for 72 h (n=3). (G) mRNA levels of SIRT1, GPX1 and PARKIN in DM1 and control fibroblasts after treatment with 1 μM of metformin 72 h (n≥2).