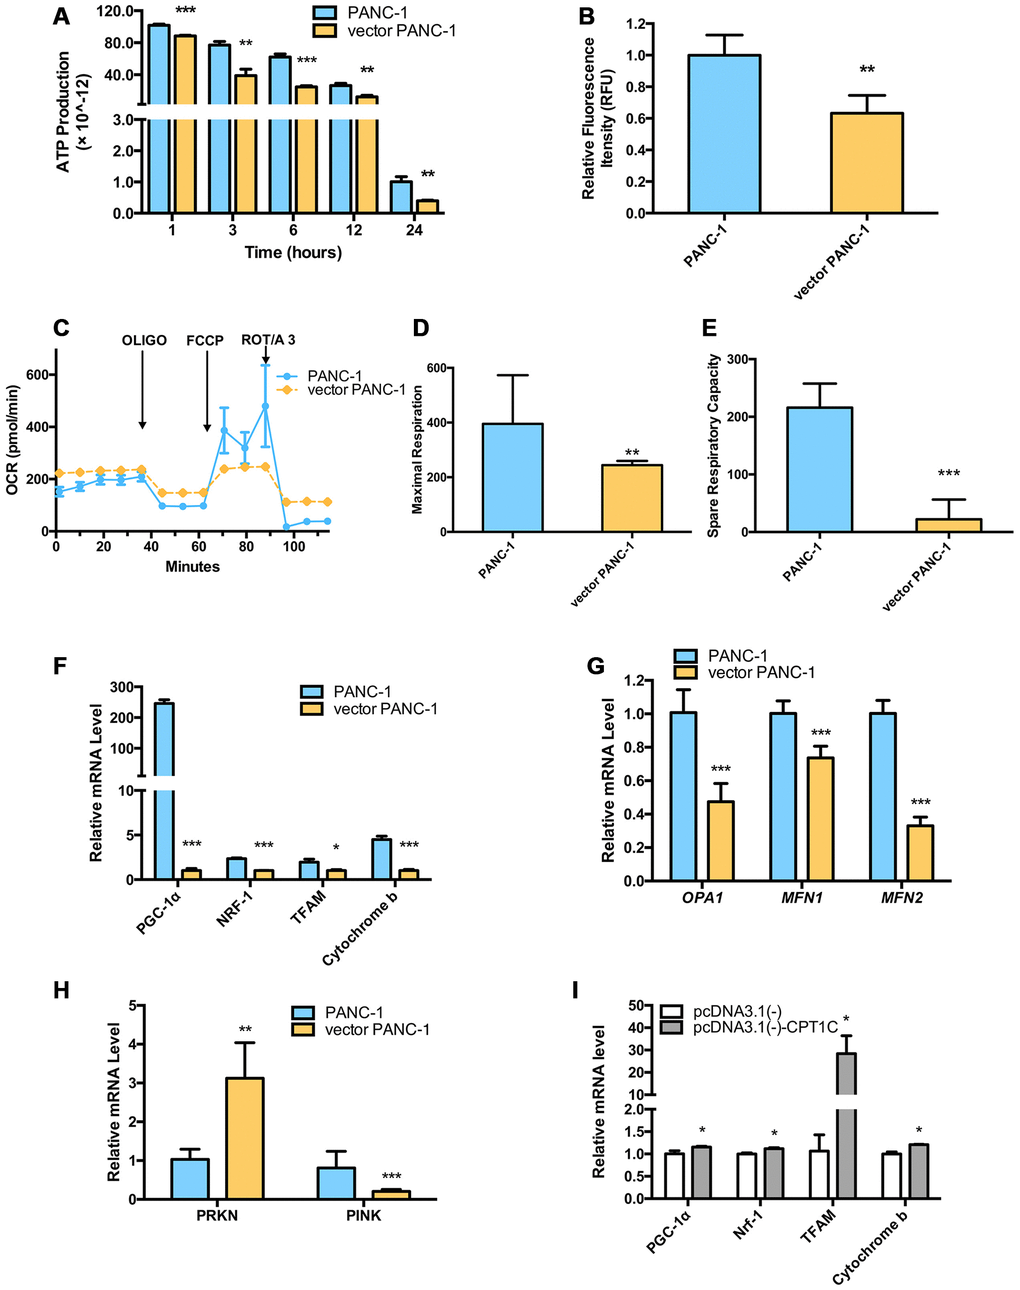
Figure 3.Dysfunctional mitochondria in low-CPT1C-expressing senescent vector PANC-1 cells. (A) ATP production in senescent vector PANC-1 cells, the magnitude of this difference increased as the time in PBS was extended to 24 h. Data are presented as the mean ± S.E.M, n = 4 (**p < 0.01, ***p < 0.001). (B) Loss of mitochondrial transmembrane potential measured by the rh123 dequenching method in senescent vector PANC-1 cells. Data are presented as the mean ± S.E.M, n = 4 (**p < 0.01). (C) Mitochondrial integrity in the forms of OCRs (pMol O2.min-1) in senescent vector PANC-1 cells. Data are presented as the mean ± S.E.M, n = 3. (D) Maximal respiration capacity in the form of OCRs in senescent vector PANC-1 cells. Data are presented as the mean ± S.E.M, n = 3 (**p < 0.01). (E) Spare respiratory capacity in the form of OCRs in senescent vector PANC-1 cells. Data are presented as the mean ± S.E.M, n = 3 (***p < 0.001). (F) Mitochondriogenesis analysis in senescent vector PANC-1 cells. Data are presented as the mean ± S.E.M, n = 3 (*p < 0.05, ***p < 0.001). (G) The mitochondrial network structure integrity analysis on the senescent cells. Data are presented as the mean ± S.E.M, n = 3 (***p < 0.001). (H) Mitochondrial autophagy analysis on the senescent cells. Data are presented as the mean ± S.E.M, n = 3 (**p < 0.01, ***p < 0.001). (I) Mitochondriogenesis analysis on senescent vector PANC-1 cells gaining of CPT1C function. Data are represented as mean ± S.E.M, n = 4 (*p< 0.05). See also Supplementary Figure 4.