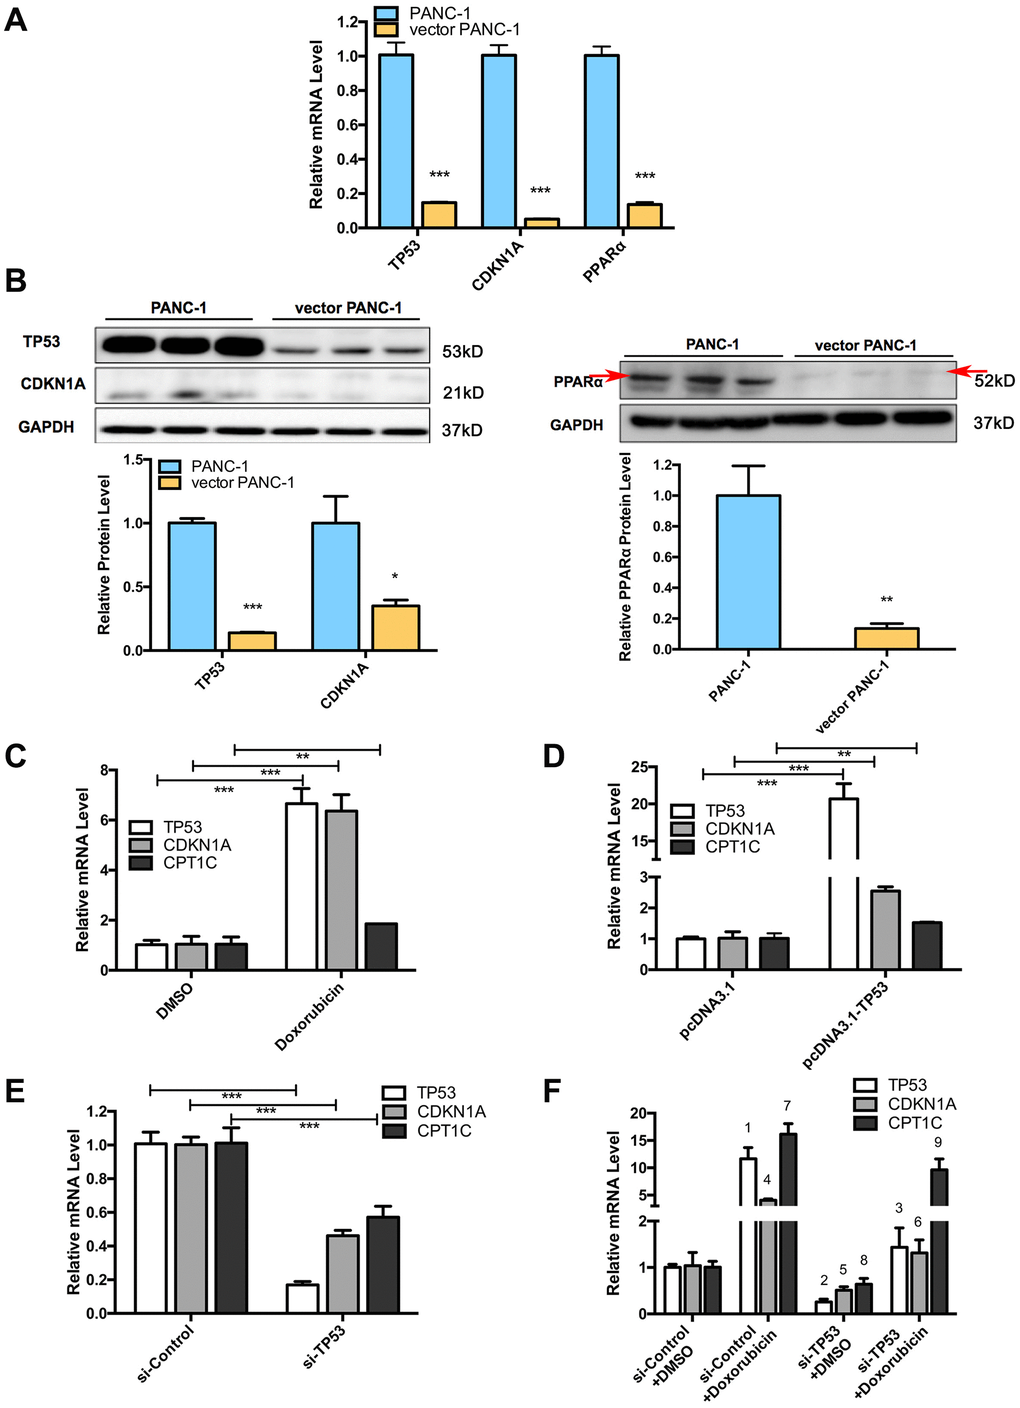
Figure 6.Signaling pathways involved in low-CPT1C-expression-induced senescence in vector PANC-1 cells and regulation of the TP53 signaling pathway on CPT1C. (A) Quantitative RT-PCR analysis for suppressed genes in senescent vector PANC-1 cells. Data are presented as the mean ± S.E.M, n = 3 (***p < 0.001). (B) Images and densitometric analysis for protein bands altered in senescent vector PANC-1 cells. The left panel shared the same GAPDH control with Figure 2D, all these bands were harvested from the same experiment. Data are presented as the mean ± S.E.M, n = 3 (*p < 0.05, **p < 0.01, ***p < 0.001). (C) The CPT1C mRNA level is upregulated after inducing TP53 mRNA expression with 0.7 μM doxorubicin (Sigma) for 24 h in PANC-1 cells. (D) CPT1C mRNA is increased after overexpressing 2 μg of TP53 plasmids for 24 h in PANC-1 cells. (E) CPT1C mRNA expression was downregulated after knockdown of TP53 mRNA expression with 50 μM si-TP53 for 72 h in PANC-1 cells. The sequences of specific human siRNAs were commercially available (RiboBio) and listed in Supplementary Table 2. The optimal sense against TP53 was the following: 5'-GCACAGAGGAAGAGAAUCU dTdT-3'. (F) Doxorubicin reversed the si-TP53-induced downregulation of CPT1C mRNA expression. For the statistical analysis of TP53 mRNA expression, 1 si-Control+Doxorubicin vs si-Control+DMSO, ***p < 0.001; 2 si-TP53+DMSO vs si-Control+DMSO, ***p < 0.001; and 3 si-TP53+Doxorubicin vs si-TP53+DMSO, **p < 0.01. For the statistical analysis of CDKN1A/P53 mRNA level, 4 si-Control+Doxorubicin vs si-Control+DMSO, ***p < 0.001; 5 si-TP53+DMSO vs si-Control+DMSO, *p < 0.05; and 6 si-TP53+Doxorubicin vs si-TP53+DMSO, **p < 0.01. For the statistical analysis of CPT1C mRNA expression, 7 si-Control+Doxorubicin vs si-Control+DMSO, ***p < 0.001; 8 si-TP53+DMSO vs si-Control+DMSO, *p < 0.05; and 9 si-TP53+Doxorubicin vs si-TP53+DMSO, **p < 0.01. See also Supplementary Figure 7.