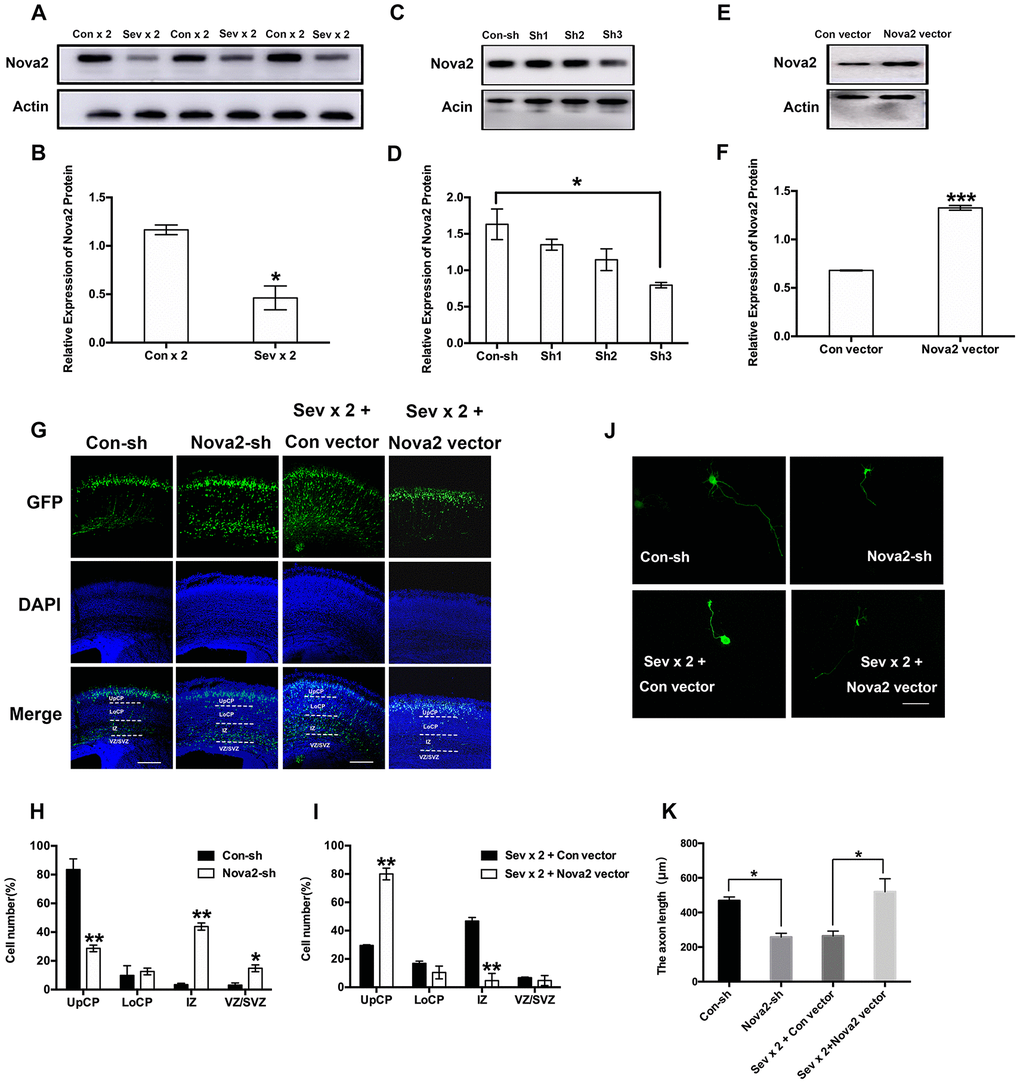
Figure 2.Nova2 deficiency contributes to the neurotoxicity induced by dual sevoflurane exposure. (A) Western blot analysis demonstrated that dual exposure to sevoflurane decreased Nova2 expression in the cortical tissues of offspring mice. (B) Quantification of the protein expressions of Nova2 relative to Actin (P = 0.0174*, N = 3, Student’s t-test). (C) Nova2 shRNA (sh3) reliably reduces the Nova2 expression. (D) Quantification of the protein expressions of Nova2 relative to Actin (F = 13.54, P = 0.0146*, N = 3, one-way ANOVA). (E) Nova2 vector significantly increased the Nova2 expression. (F) Quantification of the protein expressions of Nova2 relative to Actin (P = 0.0007***, N = 3, Student’s t-test). (G) Nova2 knockdown significantly decreased the neuronal migration cortex of offspring mice, while overexpression (OE) of Nova2 reversed loss of function. Scale bars=200 μm. (H) Quantification of GFP+ cells at different positions in different groups. Compared to the Con-sh group, the Nova2-sh group had significantly larger fractions of neurons in the IZ (43.86 ± 2.49%, P = 0.0021**, N = 3, Student’s t-test) and the VZ/SVZ (14.84 ± 2.4 %, P = 0.0283*, N = 3, Student’s t-test), and a significantly smaller fraction of neurons in the UpCP (28.68 ± 2.2768%, P = 0.0098**, N = 3, Student’s t-test). (I) Quantification of GFP+ cells at different positions in different groups. Nova2 OE reversed dual sevoflurane-induced neuronal migration deficits, neurons primarily migrated out of the IZ (4.735 ± 5.084%, P = 0.009**, N = 3, Student’s t-test), and were positioned within the UpCP (80.015 ± 4.1507%, P = 0.0034**, N = 3, Student’s t-test) and LoCP (10.47 ± 4.483%, P = 0.1957, N = 3, Student’s t-test). (J) Nova2 knockdown decreased axon length in primary cultured mouse cortical neurons (P = 0.0106*, Student’s t-test), while Nova2 overexpression reversed dual sevoflurane-induced axon growth deficits (P = 0.0439*, Student’s t-test). (K) The statistical results for the axon length in different groups. Scale bars = 100 μm. *P<0.05. **P<0.01, ***P<0.001.****P < 0.0001.