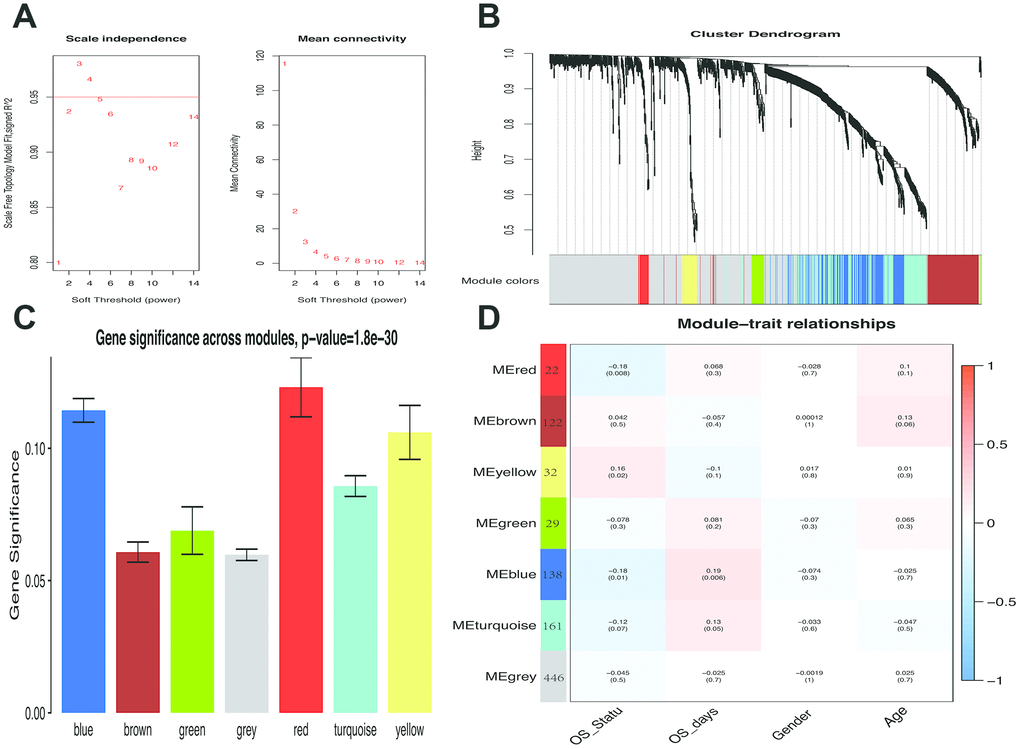
Figure 2.Weighted melanoma gene co-expression network. (A) The scale-free fit index for soft-thresholding powers. The soft-thresholding power in the WGCNA was determined based on a scale-free R2 (R2 = 0.95). The left panel presents the relationship between the soft-threshold and scale-free R2. The right panel presents the relationship between the soft-threshold and mean connectivity. (B) A dendrogram of the differentially expressed genes clustered based on different metrics. Each branch in the figure represents one gene, and every color below represents one co-expression module. (C) Distribution of average gene significance and errors in the modules associated with overall survival of melanoma patients. Based on the average linkage hierarchical clustering and the soft-thresholding power, six modules were identified. To determine the significance of each module, gene significance (GS) was calculated to measure the correlation between genes and sample traits. GS was defined as the log10 conversion of the p-value in the linear regression between gene expression and clinical data (GS = lg P). The red and blue module showed high correlation with the survival of melanoma patients. (D) A heatmap showing the correlation between the gene module and clinical traits. The red module contained 22 IRGs while the blue module contained 138 IRGs. The correlation coefficient in each cell represented the correlation between gene module and the clinical traits, which decreased in size from red to blue. The blue module showed the highest positive correlation with the survival while the red module showed the highest negative correlation with the survival.