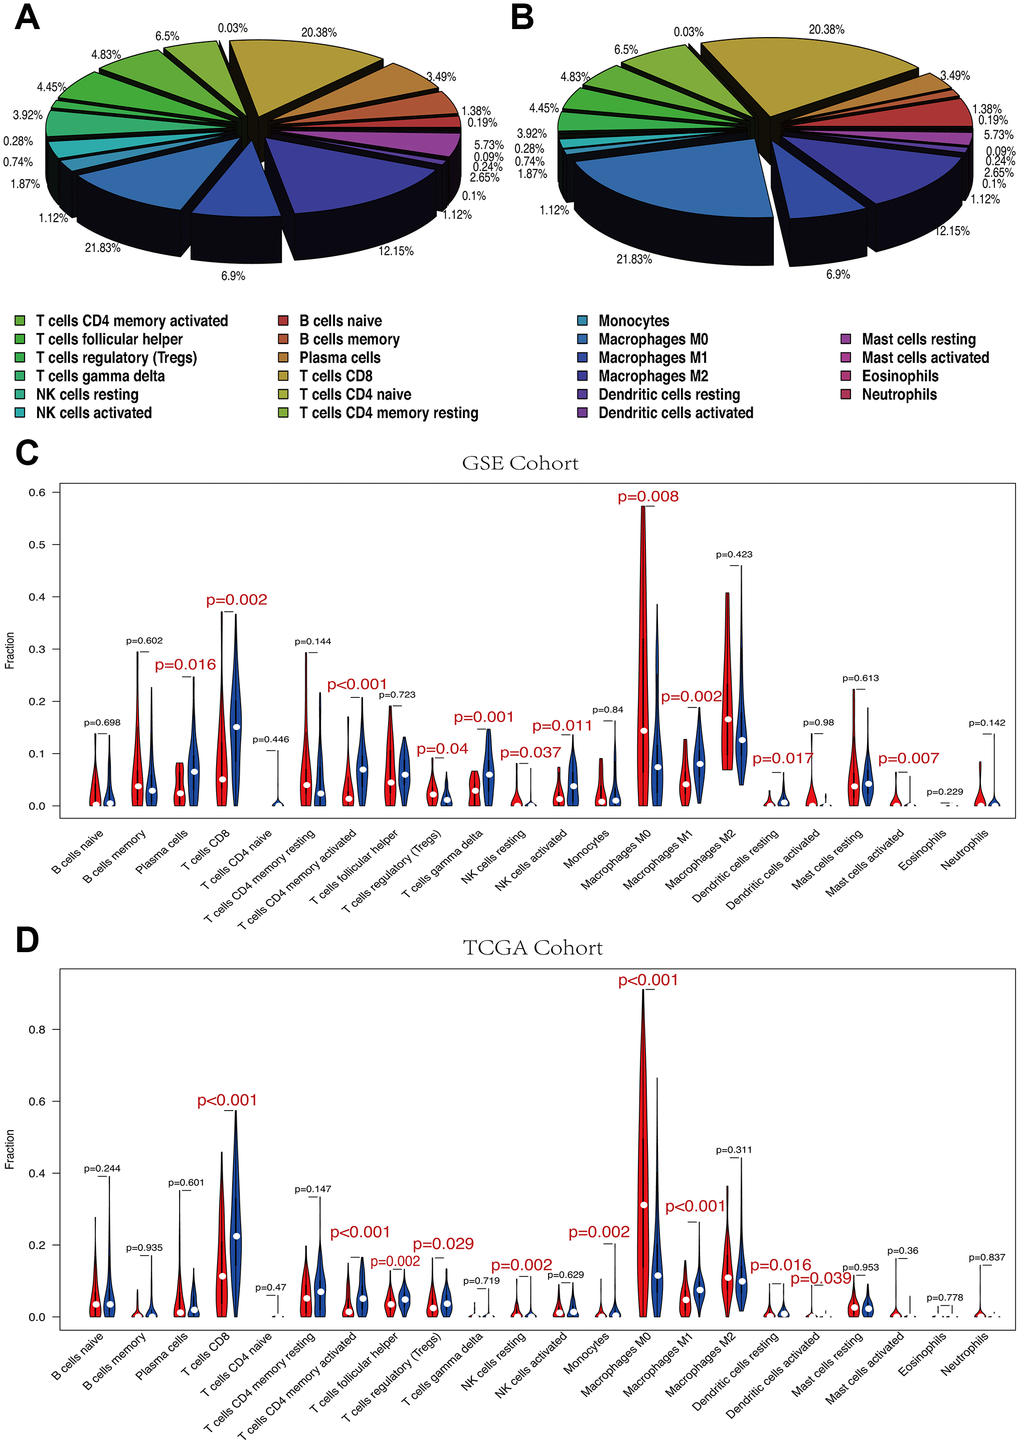
Figure 7.(A, B) The mean proportion of 22 immune cells in GSE cohort. Macrophages M0, Macrophages M2 and T cells CD8 account for a large proportion of melanoma immune cell infiltration. (A) GSE cohort. (B) TCGA cohort. (C, D) Violin plot showing the relationship between risk score with immune score and stromal score. Red color represents high-RS group while blue color represents low-RS group. Differential immune cell type expression was observed between the high and low-RS groups. (C) GSE cohort. (D) TCGA cohort.