Submit an Article
Navigate
Home
Editorial Board
Editorial Policies
Current Volume
Archive
Scientific Integrity
Publication Ethics Statements
Interviews with Outstanding Authors
Newsroom
Sponsored Conferences
Podcast
Contact
Special Collections
Submit an Article
Online ISSN: 1945-4589
Research Paper
|
Volume 12, Issue 8
|
pp. 7112–7128
Identification of immunologic subtype and prognosis of GBM based on TNFSF14 and immune checkpoint gene expression profiling
Back to article
Figure 1
(1 of 9)
−
100%
+
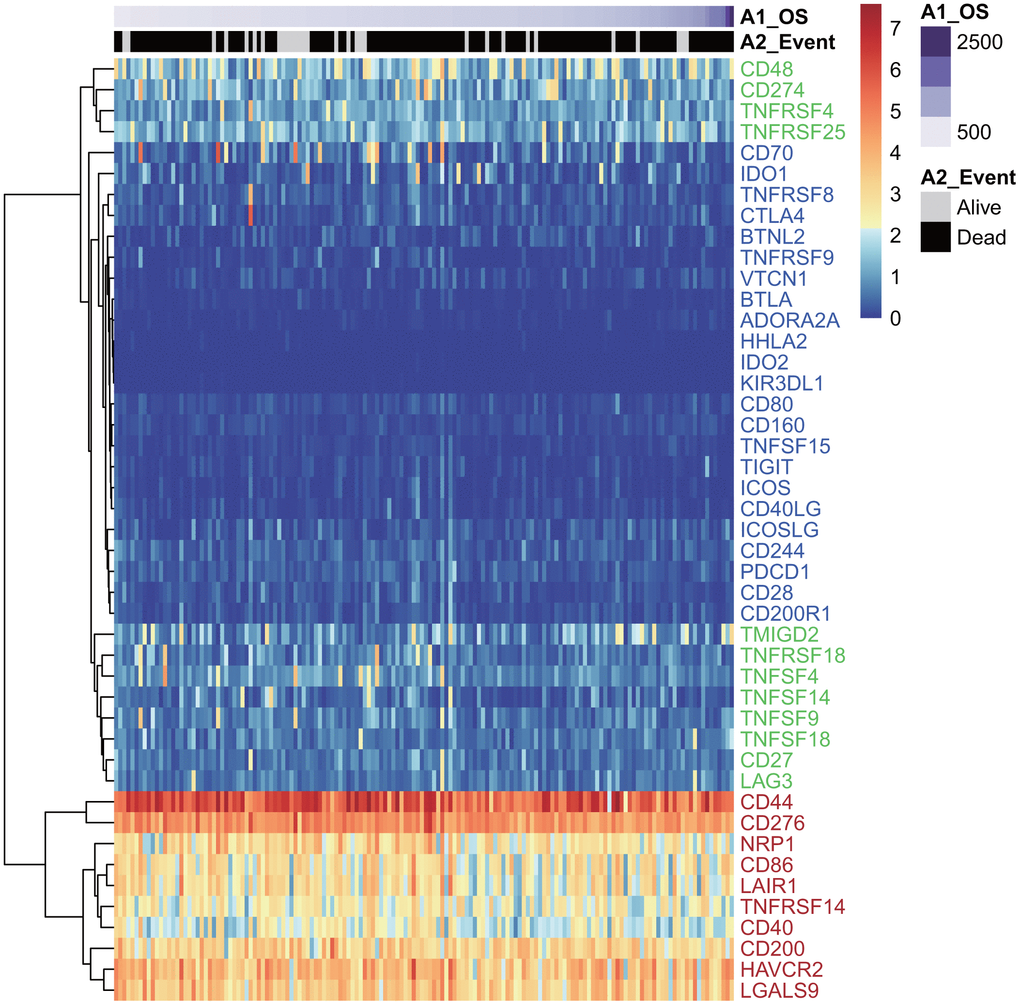
Figure 1.
The heatmap of ICG expression in the TCGA-GBM dataset.
Red indicates the high expression group; green indicates the moderate expression group; blue indicates the low expression group.