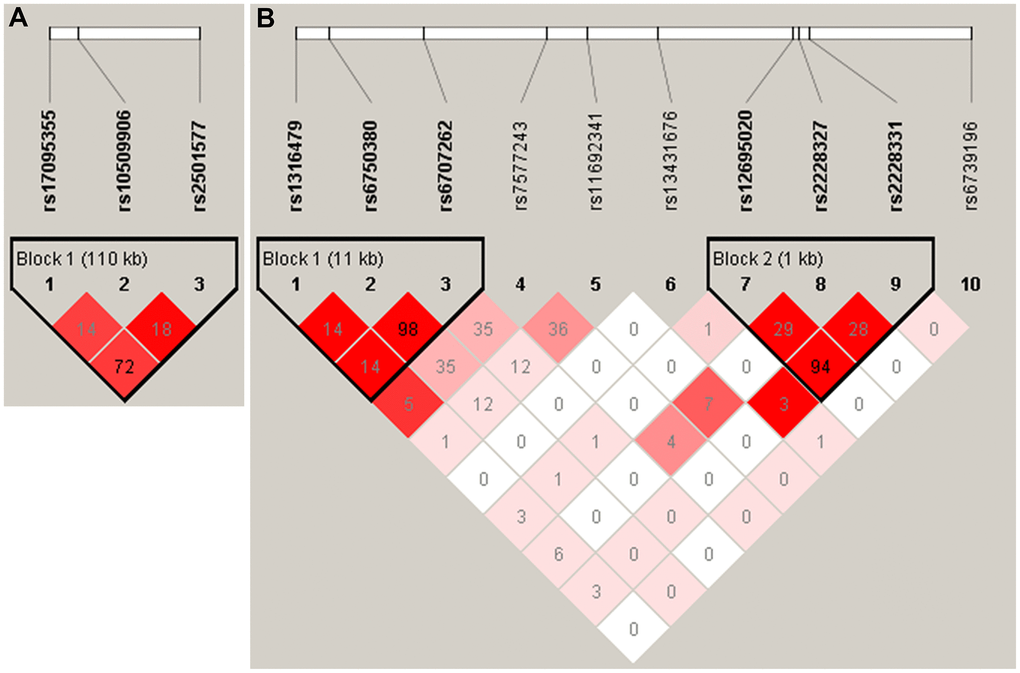
Figure 1.The linkage disequilibrium (LD) patterns of SNPs in ADD3 (A) and GPC1 (B). Haplotype blocks in ADD3 and GPC1 were defined according to the default method of Haploview. The numbers in the boxes are the pairwise correlation coefficient r2 between respective SNPs. r2 values of 1 represent complete LD, r2 values greater than 0.8 represent strong evidence of LD, r2 values of 0.2 – 0.8 represent inconclusive LD, and r2 less than 0.2 represent negligible evidence of LD The r2 value between rs6750380 and rs6707262 of was 0.98.