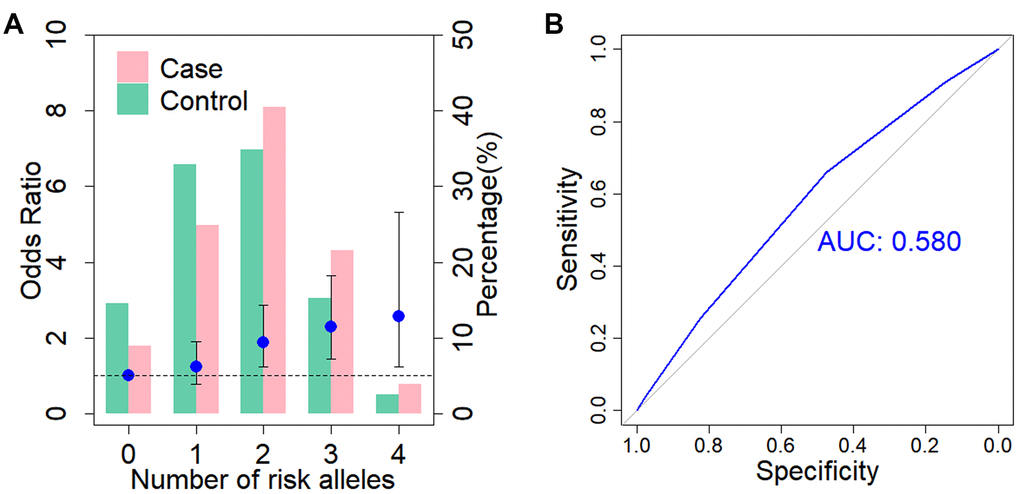
Figure 3.Cumulative impact of two associated SNPs on BA risk. (A) Distribution of cumulative risk alleles in BA cases (red) and controls (blue) for ADD3 SNP rs17095355 and GPC1 SNP rs6707262. The ORs are relative to group with zero risk alleles; vertical bars correspond to 95% confidence intervals. Horizontal line denotes the reference value (OR = 1.0). (B) Receiver operating characteristic (ROC) curve for assessment of the discriminative power of the risk prediction model. The area under curve (AUC) of the model is 0.58.