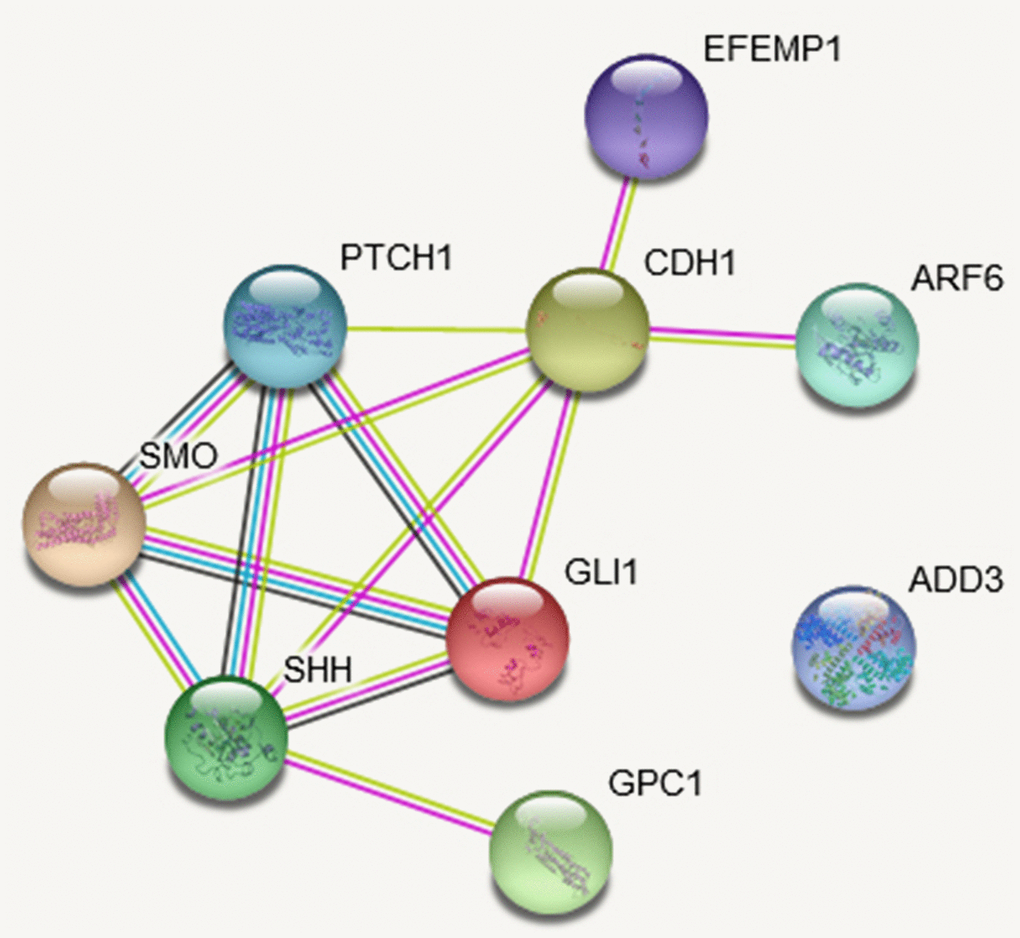
Figure 5.The protein-protein interaction (PPI) network based on STRING database of studied genes. The network is constructed for the four studies genes and Hedgehog pathway genes. The network nodes are proteins. The edges represent the predicted functional associations. An edge may be drawn with up to four different colored lines and these lines represent the existing associations that were predicted. A green line: neighborhood evidence; a blue line: cooccurrence evidence; a purple line: experimental evidence; a yellow line: textmining evidence; a black line: coexpression evidence.