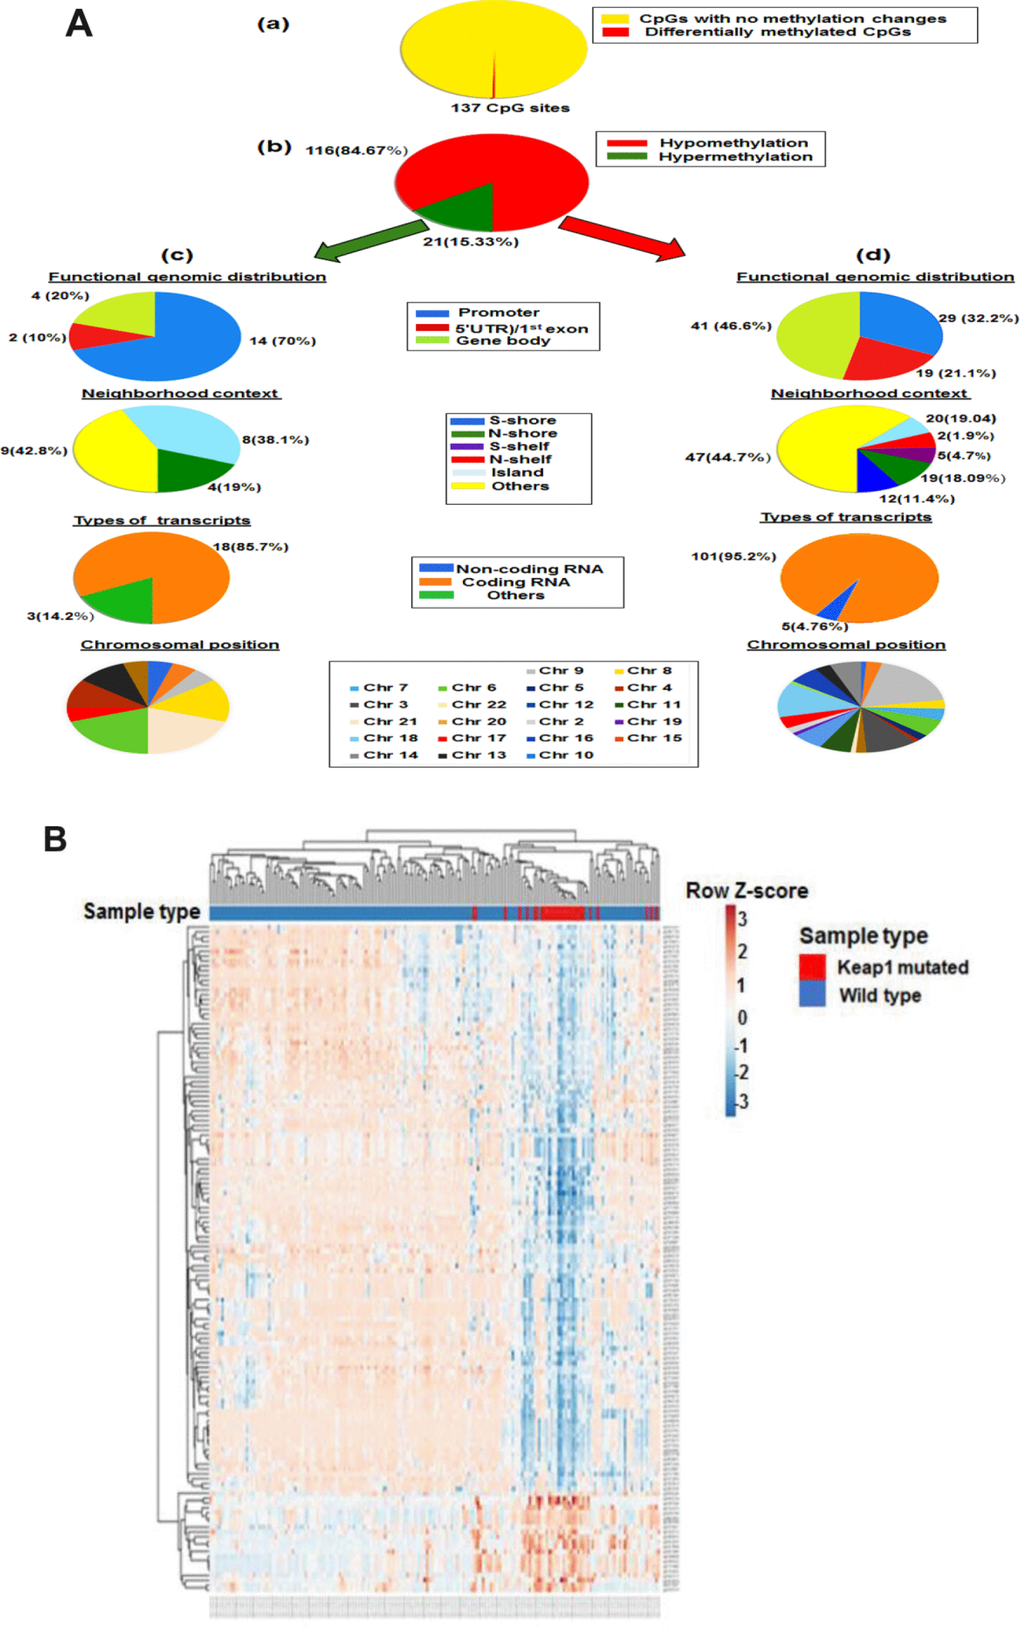
Figure 2.Differential methylation analysis of KEAP1-mutated vs wild-type LUAD patients. (A) Graphic showing 450k DNA methylation analysis. (a) Differentially-methylated CpG sites in KEAP1-mutated vs wild-type patient samples. (b) Percentages of hypomethylation and hypermethylation. (c) Distribution of hypermethylated CpG sites in KEAP1-mutated patient samples according to functional genomic distribution, neighborhood context, associated RNA transcripts, and chromosomal location. (d) Distribution of hypomethylated CpG sites in KEAP1-mutated patient samples according to functional genomic distribution, neighborhood context, associated RNA transcripts, and chromosomal location. (B) Heatmap showing the differentially-methylated CpG sites in KEAP1-mutated LUAD patients compared to their wild type counterparts (delta β >|0.2|, p<0.05 with BH-FDR adjustment). Methylation Beta-values are represented as row Z-score. The blue color indicates decreased methylation of CpG while the pink color indicates increased methylation of CpG. The heatmap was generated using the ClustVis webtool.