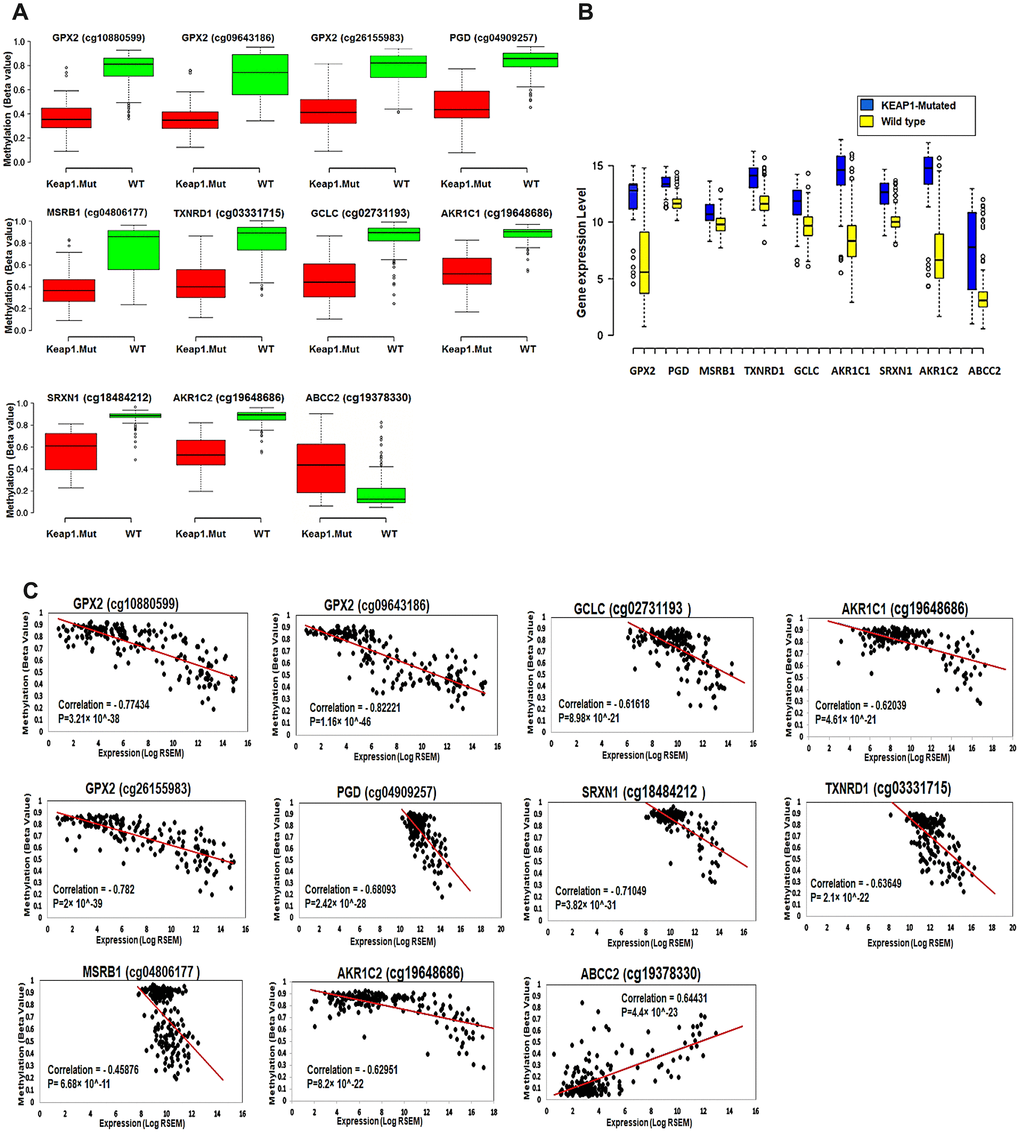
Figure 8.Effect of DNA methylation changes at the 11 CpG sites on the expression of their corresponding genes. (A) Box plots showing the differential methylation of 11 CpG sites between KEAP1-mutated and wild-type tumor samples. These 11 sites belong to the 9 genes included in the top 3 oxidative stress-related GO biological processes obtained by functional annotation analysis of the differentially-methylated genes (WT, wild-type; KEAP1.Mut, KEAP1-mutated). (B) Box plots showing the differential expression of the 9 differentially methylated genes between KEAP1-mutated and wild-type LUAD patient samples. Center lines show the medians; box limits indicate the 25th and 75th percentiles as determined by R software; whiskers extend 1.5 times the interquartile range from the 25th and 75th percentiles; outliers are represented by dots (n =100, 76, 16, 76, and 41 sample points). Boxplots were generated using BoxBlot R webtool. (C) Scatterplots showing the Spearman’s correlation between the methylation of the 11 CpG sites and the expression of their corresponding genes. A strong negative correlation can be seen between the methylation of all the CpG sites and the expression of their corresponding genes except for cg19378330 of the ABCC2 gene, which shows a strong positive correlation.