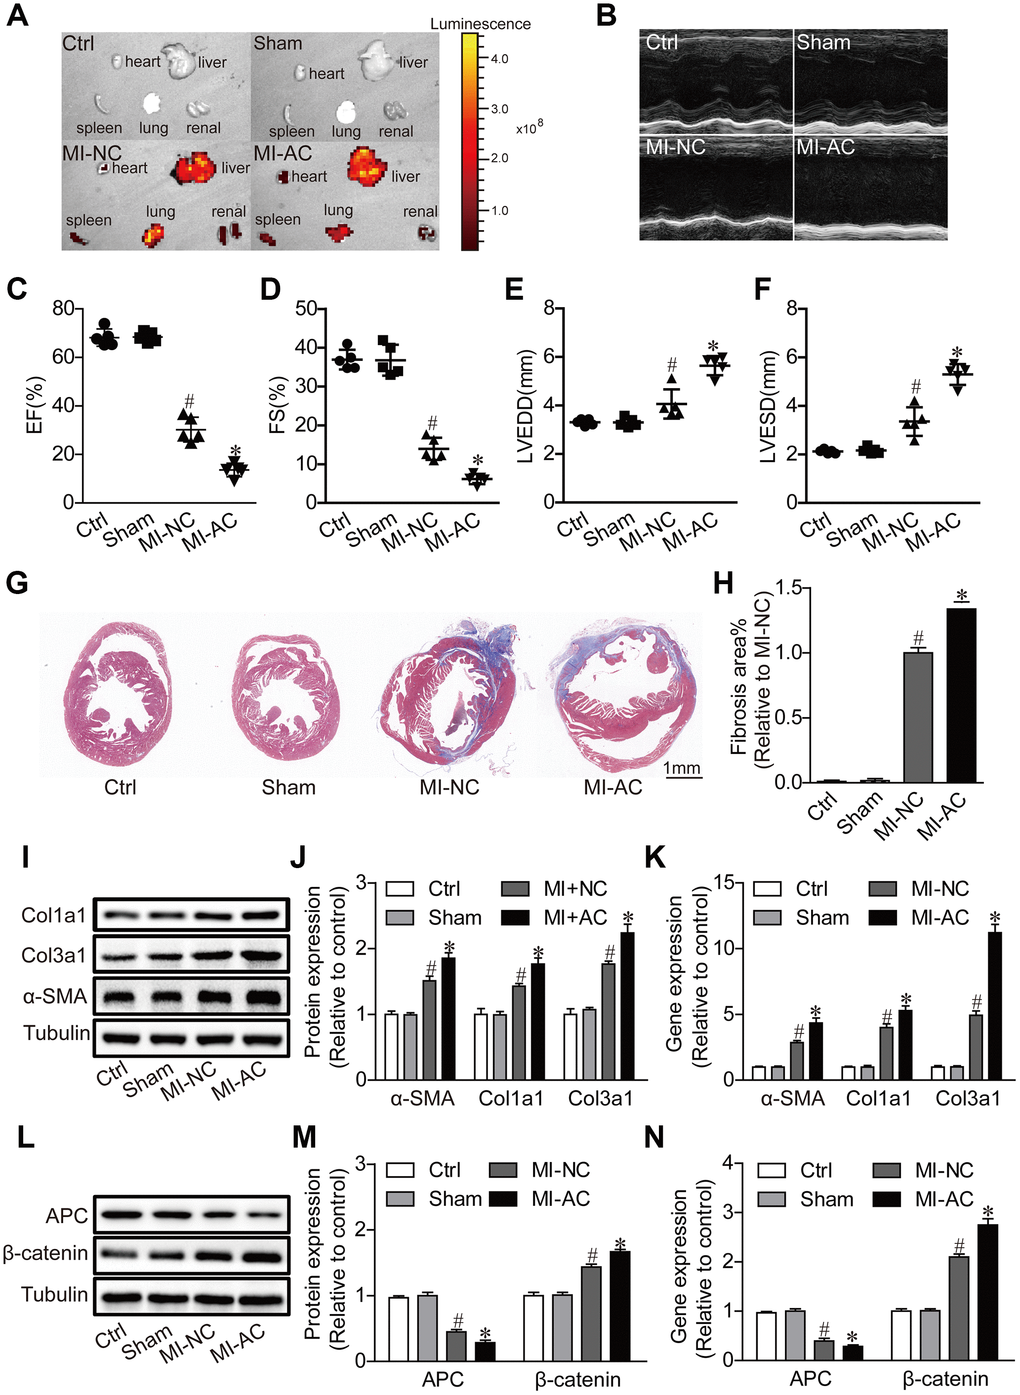
Figure 3.Activated CD4+ T cells-derived exosomes deteriorate cardiac function post-MI in mouse. (A) Ex vivo fluorescence imaging of major organs from mice. MI-NC: mice underwent myocardial infarction and injected with DiO-labeled naive CD4+- exosomes by by tail vein. MI-AC: mice underwent myocardial infarction and injected with DiO-labeled activated CD4+- exosomes by by tail vein. (B) Representative echocardiography at the fourth week post-MI. n = 5 per group. (C–F) Statistic summary from (B). EF: ejection fraction; FS: fractional shortening; LVESD: left ventricular end-systolic dimension; LVEDD: left ventricular end-diastolic dimension (n = 5). #P < .001 vs Sham. *P < .05 vs MI-NC. (G, H) Masson's trichrome staining of the cross section of the heart and quantification of the total fibrotic area using Image J software. The images shown are representative of three independent experiments. n = 5 per group. Scale bar = 1mm. #P < .001 vs Sham; *P < .05 vs MI-NC. (I) Expression levels of α-SMA, Col1a1 and Col3a1 were detected by western blot analysis. The blots shown are representative of three independent experiments. (J) Quantitative analysis of proteins expression of -SMA, Col1a1 and Col3a1 using Image J software. #P < .001 vs Sham; *P < .05 vs MI-NC. (K) qPCR analysis of α-SMA, Col1a1 and Col3a1 levels in the myocardium. n=3 per group. #P < .001 vs. Sham; *P < .05 vs. MI-NC. (L) Western blotting examination of APC and β-catenin protein expression. The blots shown are representative of three independent experiments. (M) Quantitative analysis of proteins expression of APC and β-catenin using Image J software. #P < .001 vs Sham; *P < .05 vs MI-NC. (N) qPCR analysis of APC and β-catenin levels in the myocardium. n=3 per group. #P < .001 vs. Sham; *P < .05 vs. MI-NC.