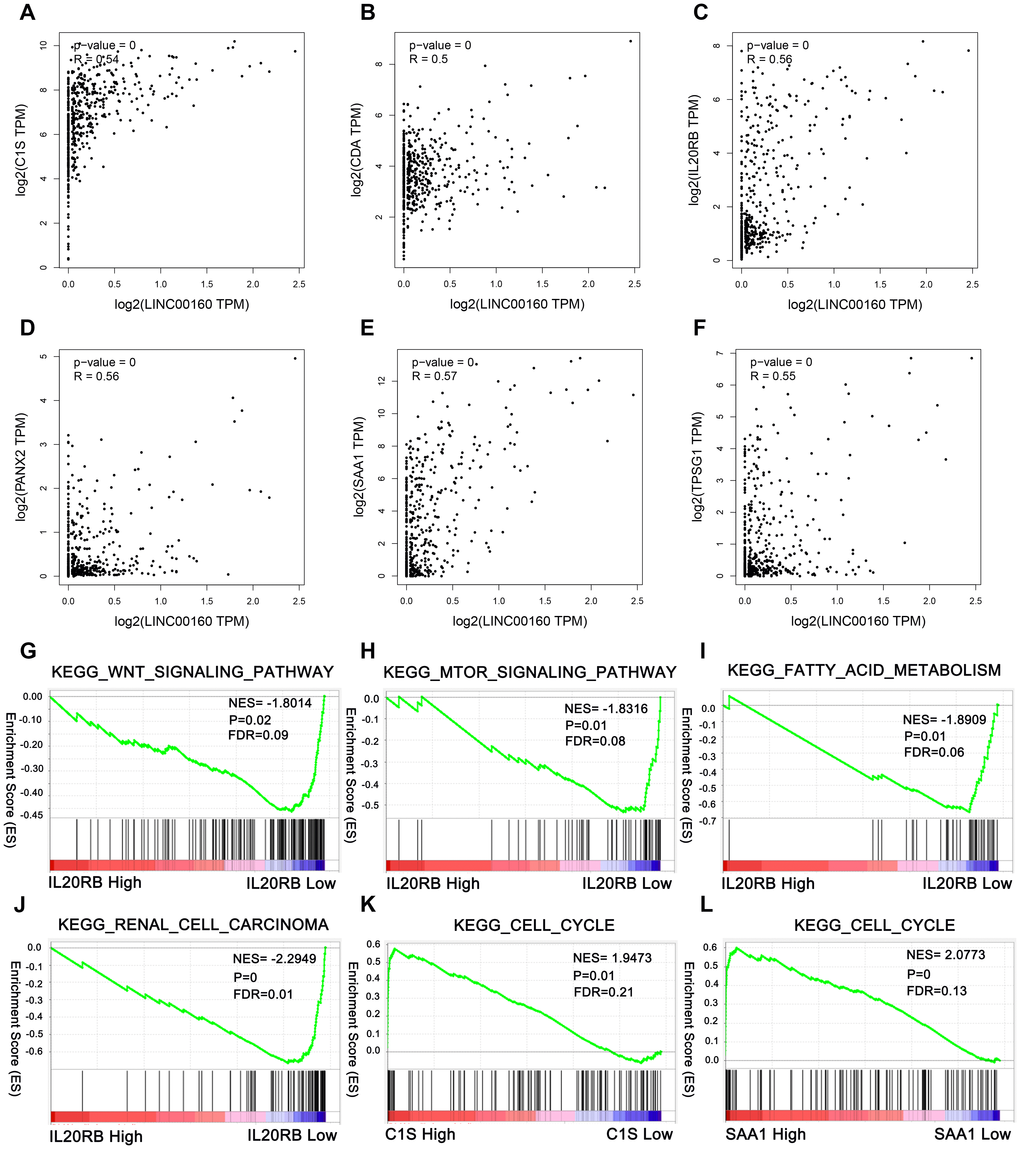
Figure 6.Correlation analysis between LINC00160 and protein-coding genes in TCGA-KIRC cohort and pathways involved in the pathogenesis of LINC00160 in TCGA-KIRC with GSEA. Correlation plots are shown with correlation coefficient more than 0.5. (A) C1S, (B) CDA, (C) IL20RB, (D) PANX2, (E) SAA1, (F) TPSG1. Enrichment curves are shown for activated gene sets related to (G) Wnt signaling pathway, (H) mTOR signaling pathway, (I) Fatty acid metabolism, (J) Renal cell carcinoma, (K) Cell cycle, (L) Cell cycle. TCGA-KIRC, The Cancer Genome Atlas Kidney renal clear cell carcinoma. FDR, false discovery rate. GSEA, gene set enrichment analysis.