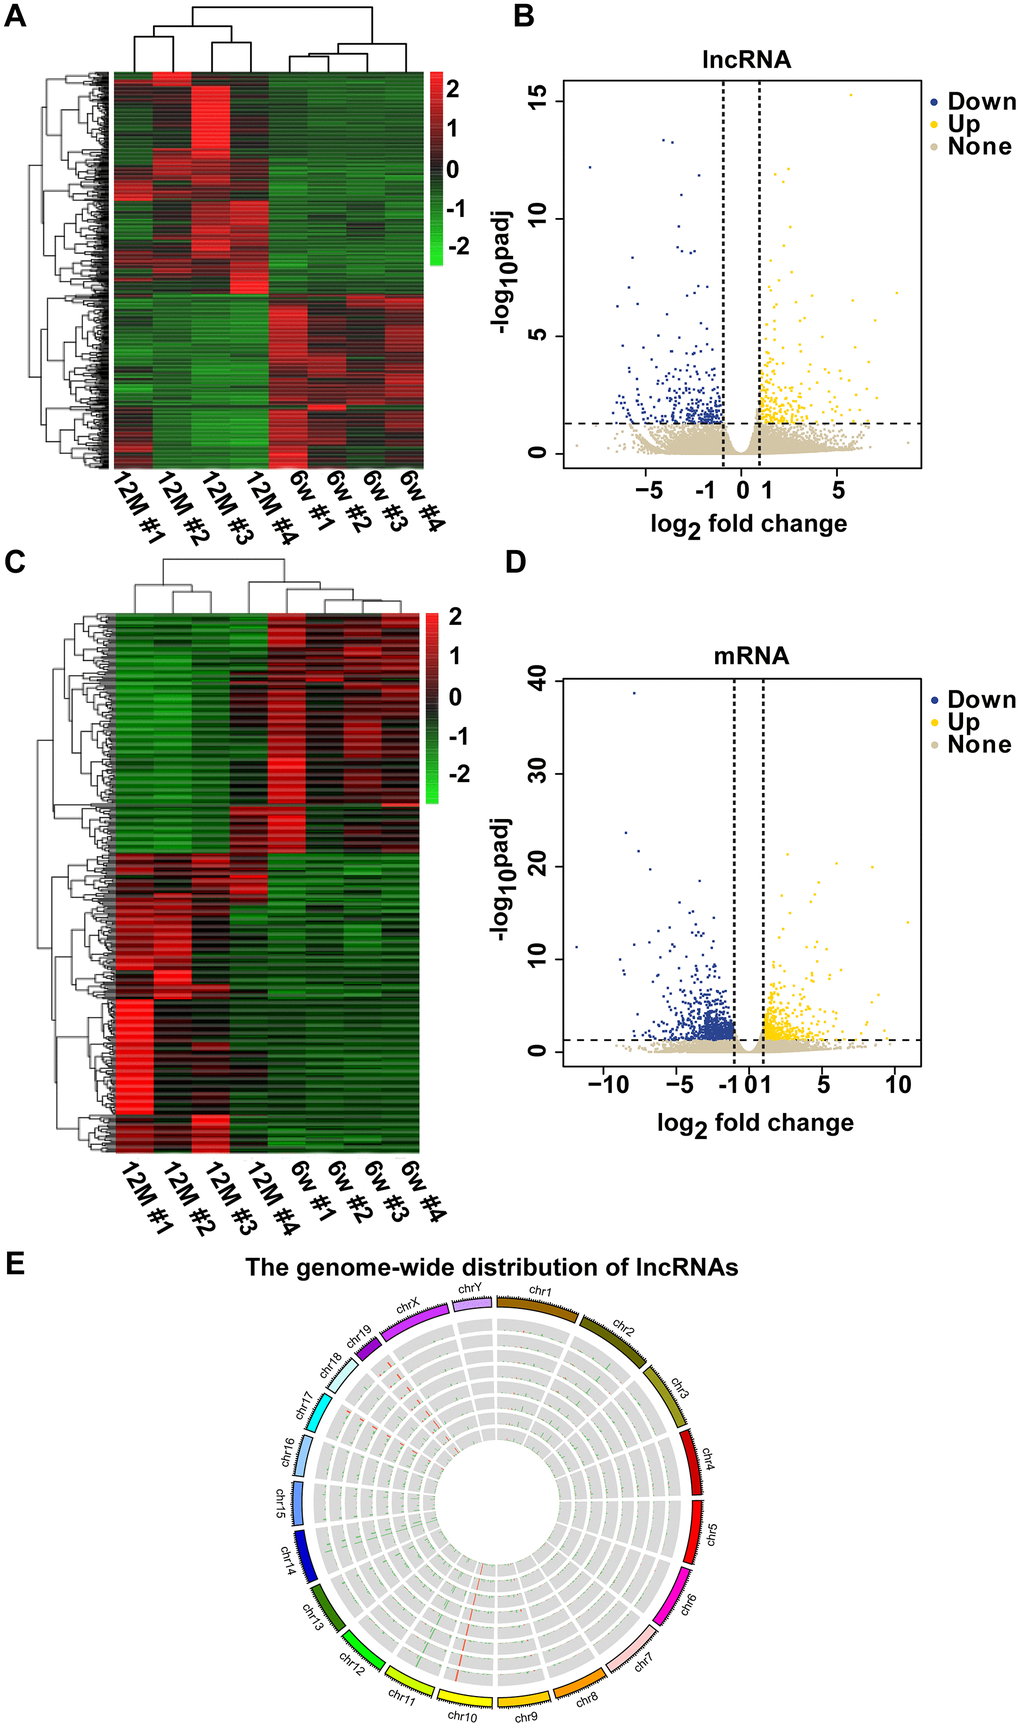
Figure 2.Clustering analysis of differentially expressed lncRNAs and mRNAs in a pair of six-week-old and one-year-old mice. The heat maps show the expression levels of differentially expressed lncRNAs (A) and mRNAs (C) between six-week-old and one-year-old mice. Items in red represent upregulated lncRNAs or mRNAs, and green items represent downregulated lncRNAs or mRNAs. Each row exhibited a lncRNA or mRNA, and each column exhibited a sample. The gradient color barcode at the top right indicates the log2 FPKM. Scatter plots of all expressed lncRNAs (B) and mRNAs (D) in six-week-old versus one-year-old mice. The X-axis presents the log2 fold change of lncRNA or mRNA expression. Yellow indicates upregulated lncRNAs or mRNAs, blue indicates downregulated lncRNAs or mRNAs, and gray indicates nonregulated lncRNAs or mRNAs. The vertical dotted lines indicate |log2 fold change| = 1. (E) Circular representation of the genome-wide distribution of the expression of detected lncRNAs by RNA sequencing. Each single circle represents a sample.