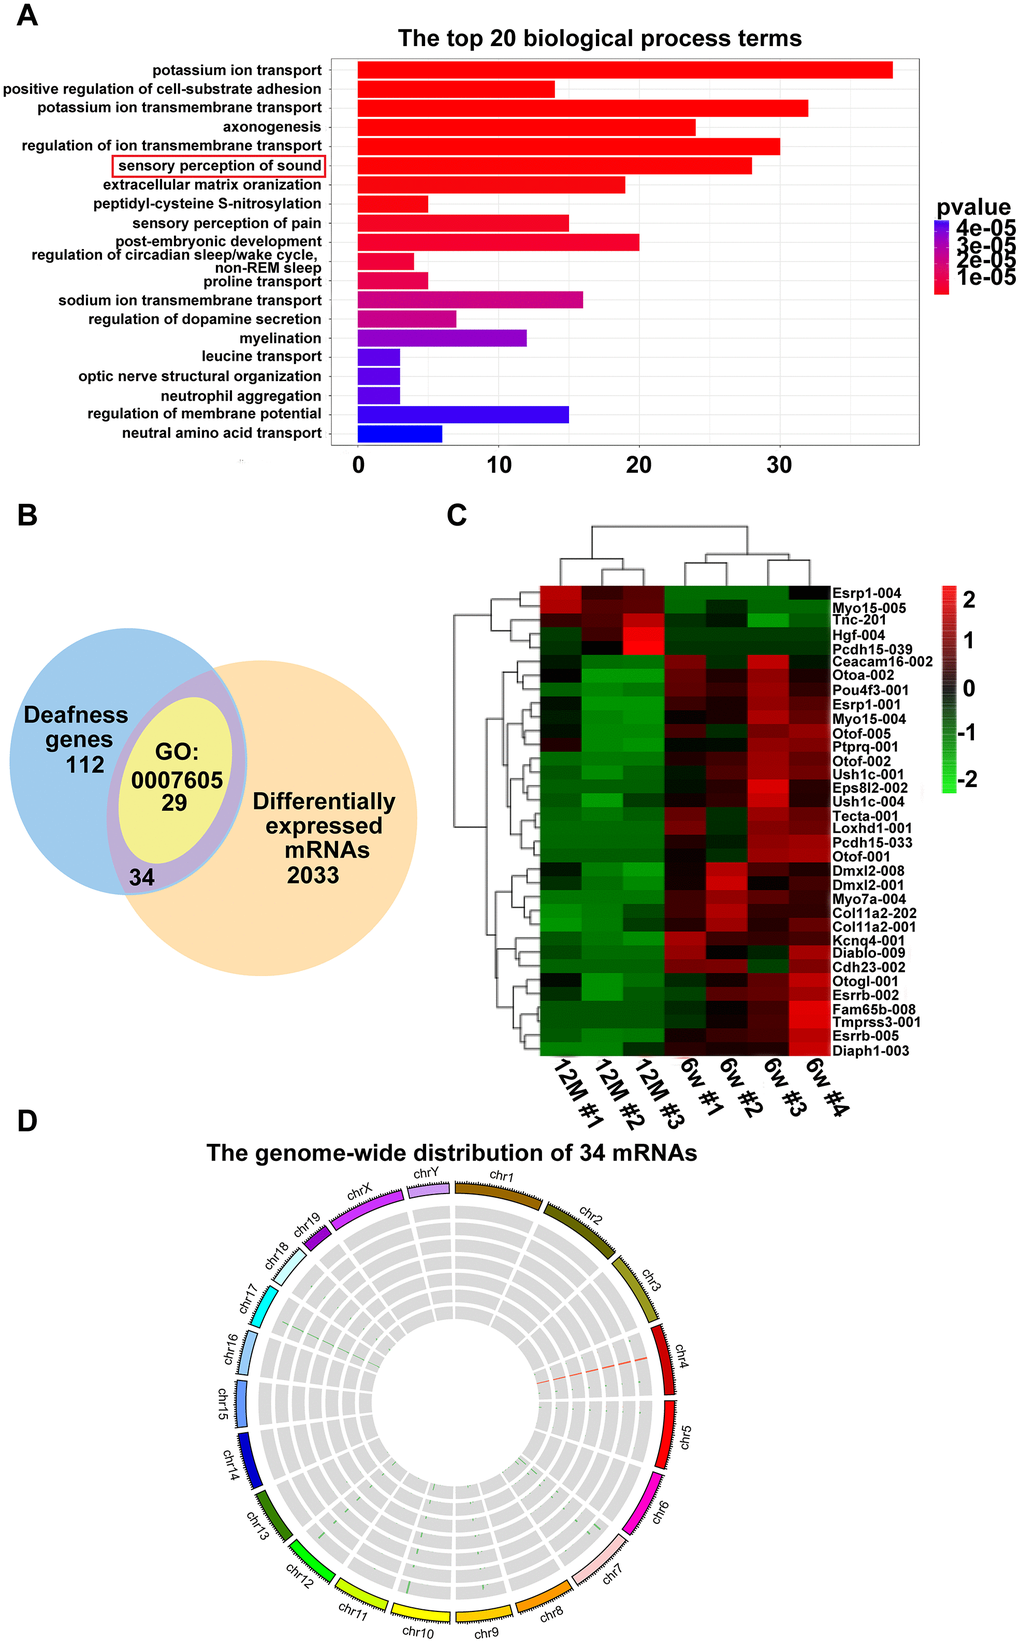
Figure 3.Hearing loss-related differentially expressed mRNAs. (A) Enriched biological process of six-week-old versus one-year-old mice. The x-axis indicates the number of differentially expressed mRNAs, and the y-axis indicates the top 20 biological process terms. (B) Venn diagram showing the intersection of popular genes associated with hearing loss, differentially expressed genes in RNA-seq, and genes enriched in sensory perception of sound (GO:0007605). (C) Hierarchical clustering of the 34 mRNAs. Green to red indicate the low-to-high expression levels. The gradient color barcode at the top right indicates the log2 FPKM. (D) Thirty-four mRNAs mapped to a chromosome. Each single circle represents a sample.