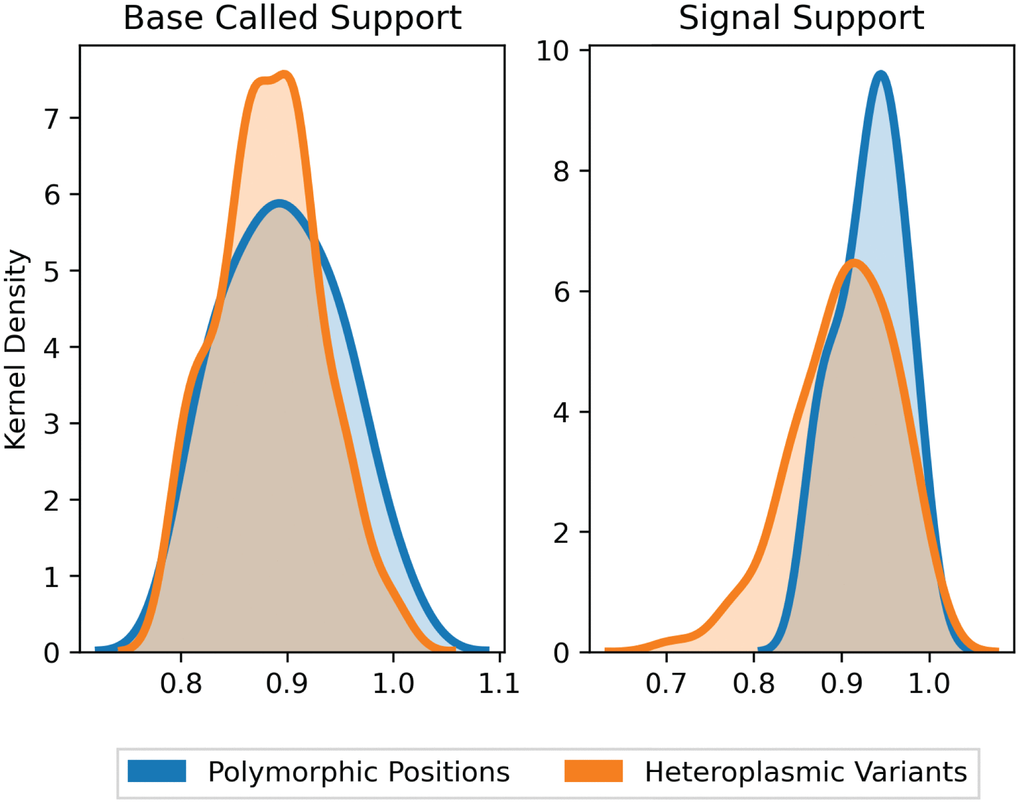
Figure 2.Support fraction distributions for polymorphic and heteroplasmic variants. Average base-called support fractions for polymorphic (blue, n = 36) and heteroplasmic (orange, n = 96) variants were 90.1% ± 1.7% and 89.2% ± 0.4%, respectively (mean ± SEM). Likewise, signal support fractions were comparable across polymorphic (93.5% ± 0.7%) and heteroplasmic (92.1% ± 0.6%) variants (mean ± SEM). Distributions are Kernel Density Estimates of base-called and signal support fractions, as determined by nanopolish for all variants. Base-called support and signal support fraction distributions were not significantly different (P = 0.39 and P = 0.17, respectively).