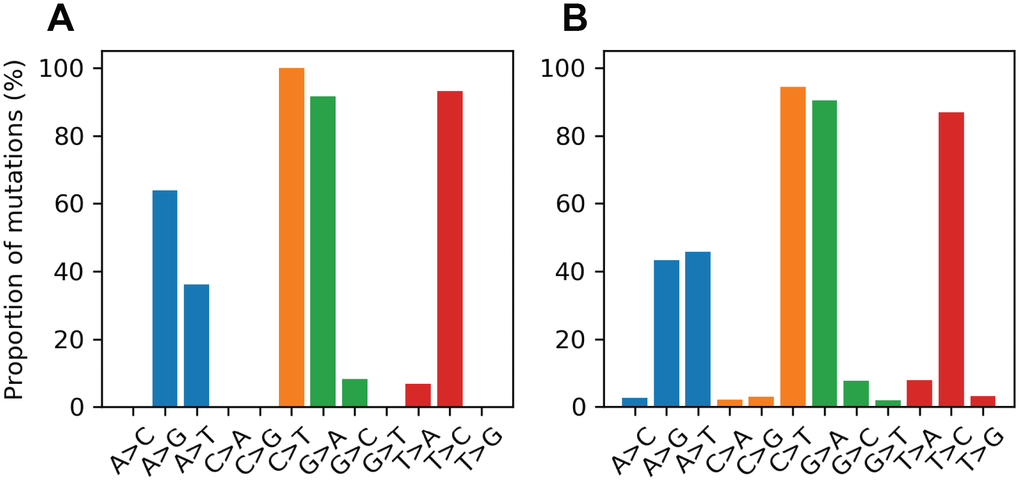
Figure 4.Proportional mutational spectra for the LUCS and Sanger sequencing datasets. (A, B) The mutation spectrum was determined for each reference nucleotide for the LUCS (A) and Sanger sequencing (B) datasets. Each bar represents the proportion of a variant for a given reference base. For example, the A>G bar is the number of A>G mutations divided by the number of mutated positions that are adenines in the reference sequence. For cytosine, guanine and thymine positions, both LUCS and Sanger mutations exhibited a strong bias towards transitions. Adenine positions were more likely to mutate as a thymine transversion than as a transition in the Sanger dataset, which was reflected to a slightly lesser degree in the LUCS dataset.