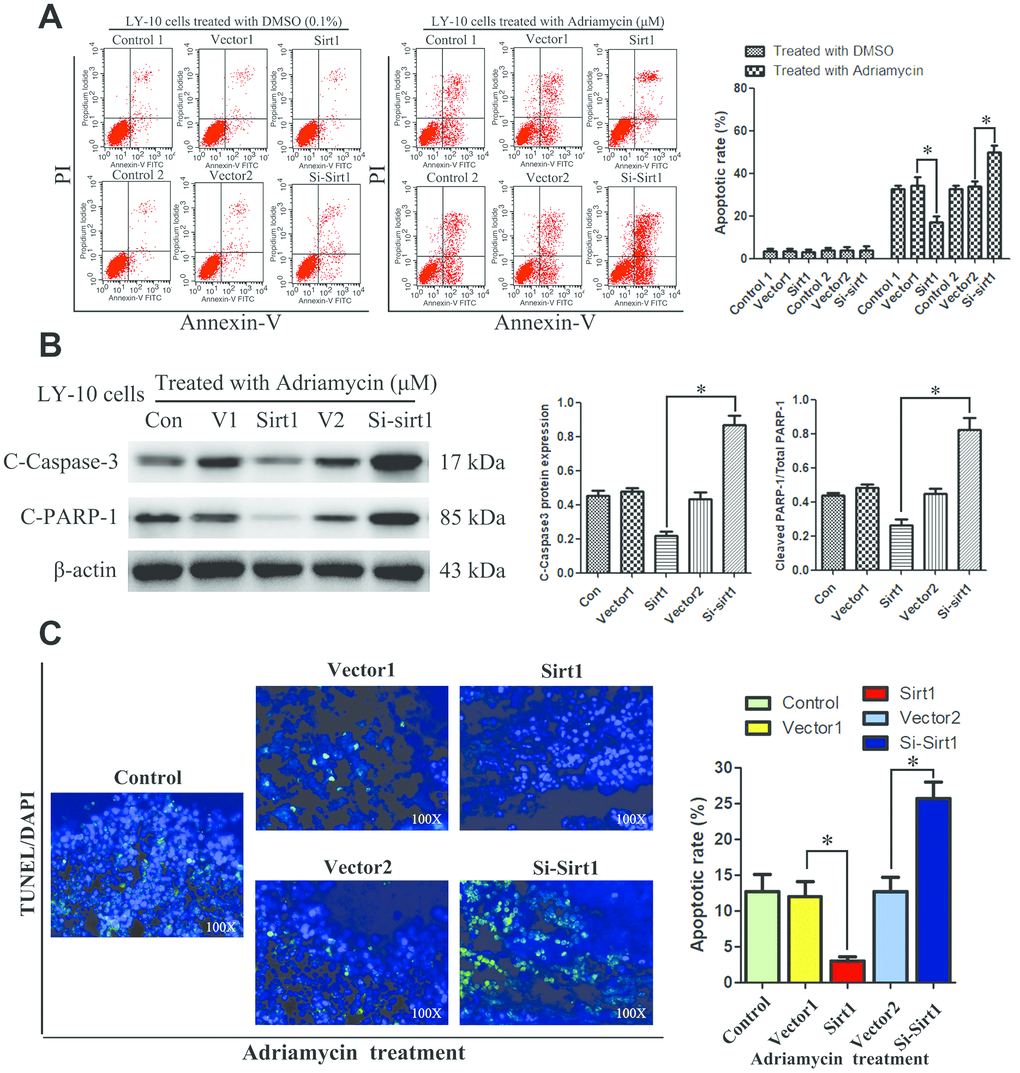
Figure 3.Silencing Sirt1 sensitizes LY-10 cells to apoptosis induced by Adriamycin in vitro. (A) LY-10 cells were treated with Adriamycin (0.5 μM) and DMSO (0.1%) for 24 hours, and the apoptotic rate was analyzed using flow cytometry. The graphs show the number of apoptotic cells in each group of cells. The apoptotic cells refer to the sum of the upper and lower right quadrant cells. Data were analyzed using Prism v5.0 (GraphPad Software, San Diego, CA, USA). (B) LY-10 cells treated with Adriamycin (0.5 μM) for 24 hours. The protein expression of cleaved-caspase3 and cleaved-PARP were detected using western blotting. The western blotting bands were quantified using Quantity One software. Each sample was normalized to the expression of β-actin. All experiments were performed in triplicate. * p<0.05. (C) LY-10 cells treated with Adriamycin (0.5 μM) for 24 hours. TUNEL staining demonstrating the expression of TUNEL-positive cells in the LY-10 cells is shown (200 ×).