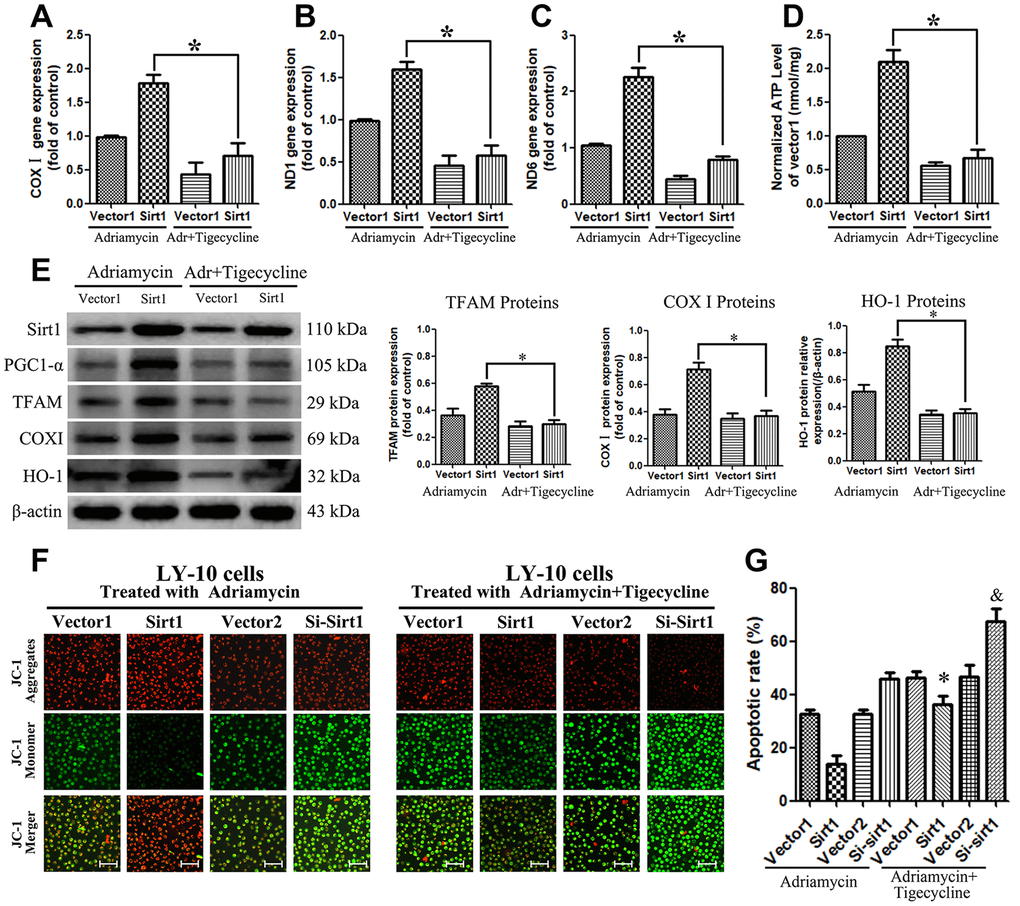
Figure 9.Blocking the PGC1-α-mitochondrial pathway can counteract the resistance of LY-10 cells to Adriamycin caused by the overexpression of Sirt1. (A–D) LY-10 cells were treated with Adriamycin (0.5 μM) and Adriamycin (0.5 μM) + Tigecycline (50 μM) for 24 hours and the mitochondrial genes (COX I, ND1 and ND6) were detected using real-time PCR assays. Furthermore, the relative content of ATP was detected using ATP Kit assays on a microplate. (E) The protein expression of Sirt1, PGC1-α, TFAM, COX I and HO-1 were detected using western blotting. Western blotting bands were quantified using Quantity One software. All experiments were performed in triplicate. * p<0.05, ** p<0.01. (F) Changes in mitochondrial transmembrane potential in different groups of LY-10 cells. The representative images show JC-1 aggregates, JC-1 monomers and merged images of both (Scale bars: 100μm). (G) LY-10 cells were treated with Adriamycin (0.5 μM) and Adriamycin (0.5 μM) + Tigecycline (50 μM) for 24 hours, and the apoptosis rate was detected using flow cytometry. Graphs show the number of apoptotic cells in each group of cells. Data were analyzed using Prism v5.0 (GraphPad Software, San Diego, CA, USA). All experiments were performed in triplicate. * Sirt1 (Adriamycin) group compared with Sirt1 (Adriamycin+Tigecycline) group (p<0.05). & Si-Sirt1 (Adriamycin) group compared with Si-Sirt1 (Adriamycin+Tigecycline) group (p<0.01).