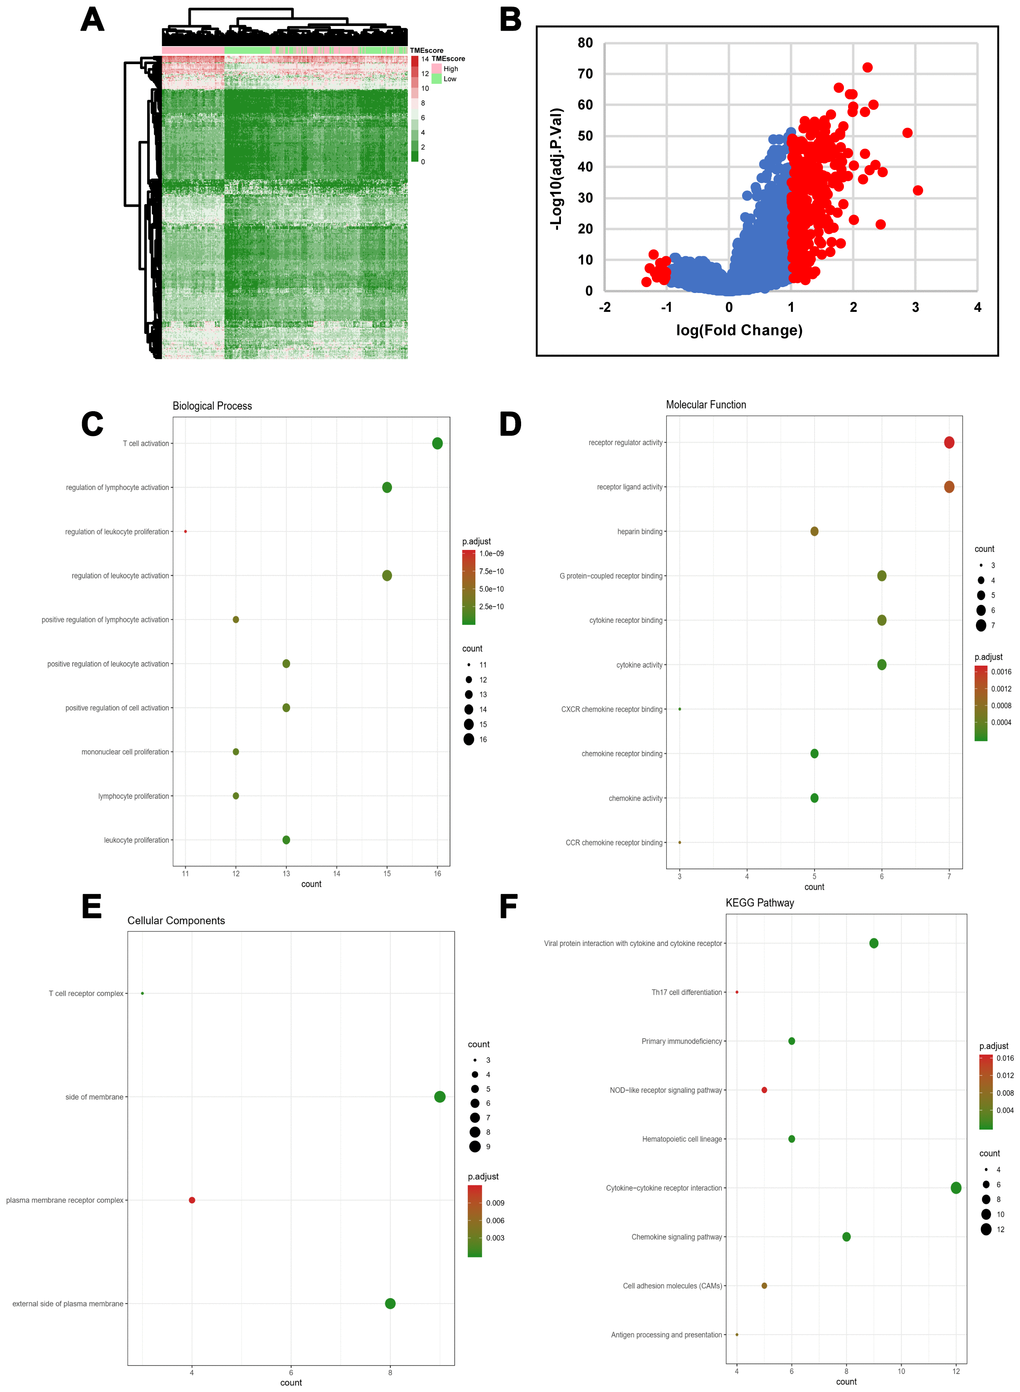
Figure 2.DEG profiles by TMEscore in HGSOC. (A) Heatmap of the DEGs between the top half (high score) vs. bottom half (low score) of TMEscore values. A |log(fold change)|≥1 and an adjusted p-value < 0.05 were set as the cutoff criteria to screen for DEGs. (B) Volcano plot of gene expression profile data for patients with high and low TMEscores. (C–F) Functional enrichment analysis including Biological Process (BP), Cellular Components (CC), and Molecular Functions (MF) categories as well as KEGG pathways for 329 DEGs.