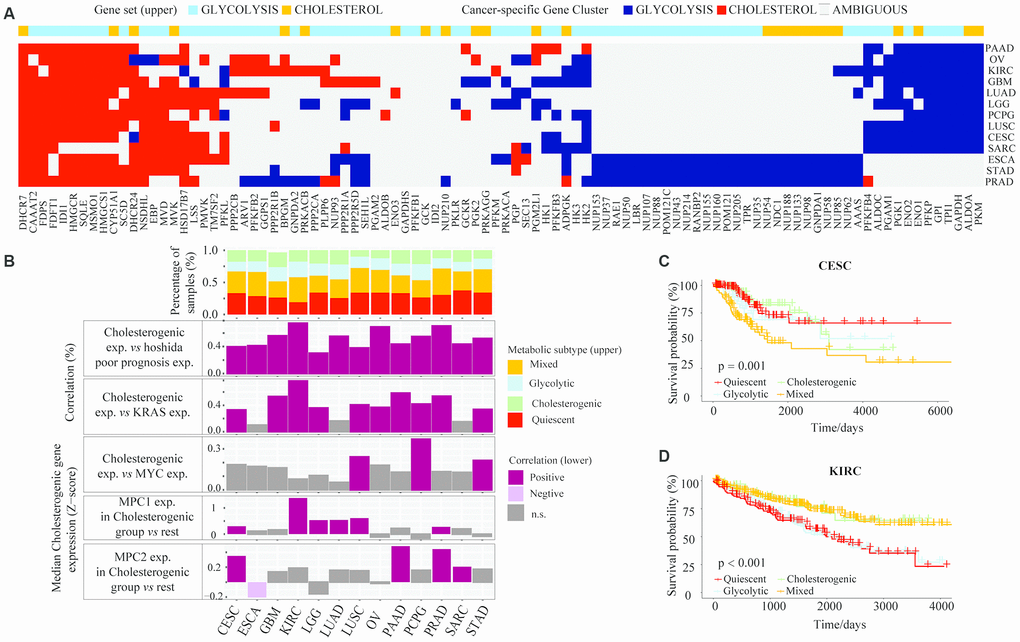
Figure 5.The glycolytic and cholesterogenic gene profiles of other cancer types. (A) Heat map depicting that glycolytic and cholesterogenic genes were robustly co-expressed when consensus clusters were applied to each individual cancer type. (B) Top: Bar plots showing the proportions of the metabolic subgroups across the various cancer types. Bottom: The correlation between cholesterogenic gene expression and the expression of Hoshida poor prognostic genes, KRAS, MYC and MPC1/2 in each cancer type. Median glycolytic gene expression correlated positively (BH-adjusted p < 0.05) with basal-like gene expression in all cancer types. The correlation between MPC1/2 expression and glycolytic gene expression was validated using Wilcoxon rank sum tests and BH correction. (C) Kaplan-Meier survival analysis curves depicting the differences in median overall survival across the metabolic subgroups in CESC. (D) Kaplan-Meier survival analysis curves demonstrating the differences in median overall survival in KIRC.