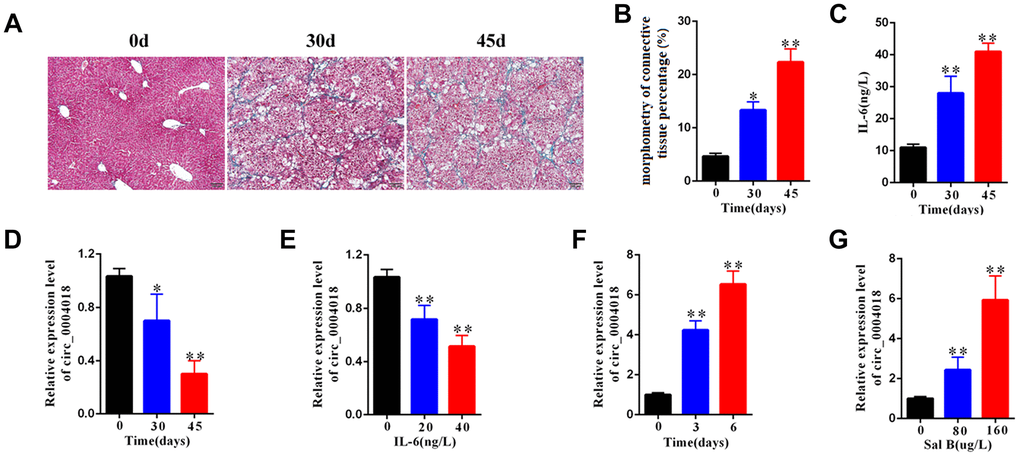
Figure 1.The expression level of hsa_circ_0004018 was downregulated in mouse liver fibrosis model. (A) The representative Masson’s trichrome staining of the liver samples isolated from the liver fibrosis mice sacrificed on day 0, 30 and 45 upon injection with CCl4. Five mice were sacrificed at each time point. (B) The percentages of fibrosis area of the liver samples isolated from the liver fibrosis mice sacrificed on day 0, 30 and 45 were counted through analyzing the proportion of the blue staining area by Image J software. Three visual field of each sample were analyzed. (C) IL-6 level in serum of the liver fibrosis mice sacrificed on day 0, 30 and 45 upon injection with CCl4. (D) The relative expression levels of hsa_circ_0004018 of the indicated liver samples were detected by real-time PCR. (E) The relative expressions levels of hsa_circ_0004018 of the primary HSCs treated with IL-6 at 0, 20 and 40 ng/L for 24 hours. (F) The relative expressions levels of hsa_circ_0004018 of the primary HSCs treated with Sal B (100ug/L) for 0, 2 and 5 days. (G) The relative expression levels of hsa_circ_0004018 of the primary HSCs treated with 0, 80 and 160ug/L Sal B respectively.