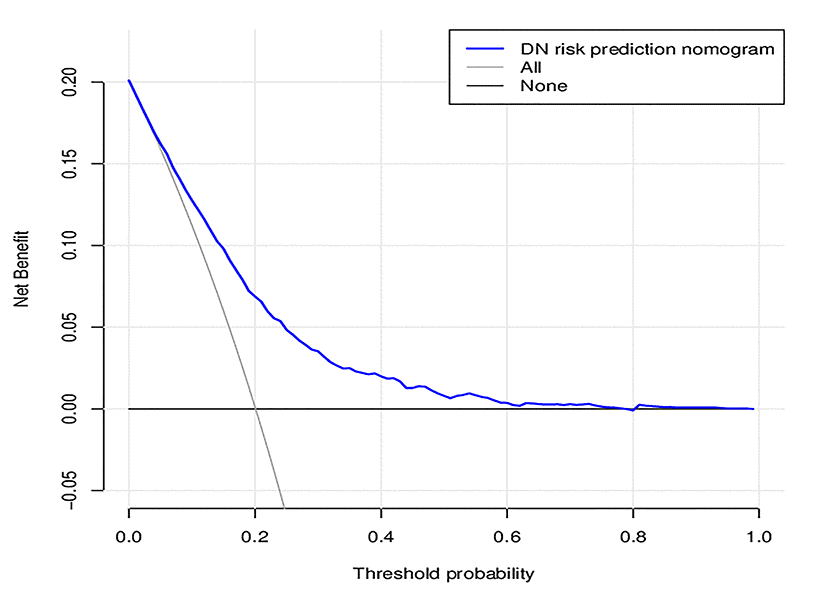
Figure 6.Decision curve analysis for the DN incidence risk nomogram. The y-axis measures the net benefit. The dotted line represents the DN incidence risk nomogram. The thin solid line represents the assumption that all patients are diagnosed as DN. Thin thick solid line represents the assumption that no patients are diagnosed as DN. The decision curve showed that if the threshold probability of a patient and a doctor is >20%, respectively, using this DN incidence risk nomogram in the current study to predict DN incidence risk adds more benefit than the intervention-all-patients scheme.