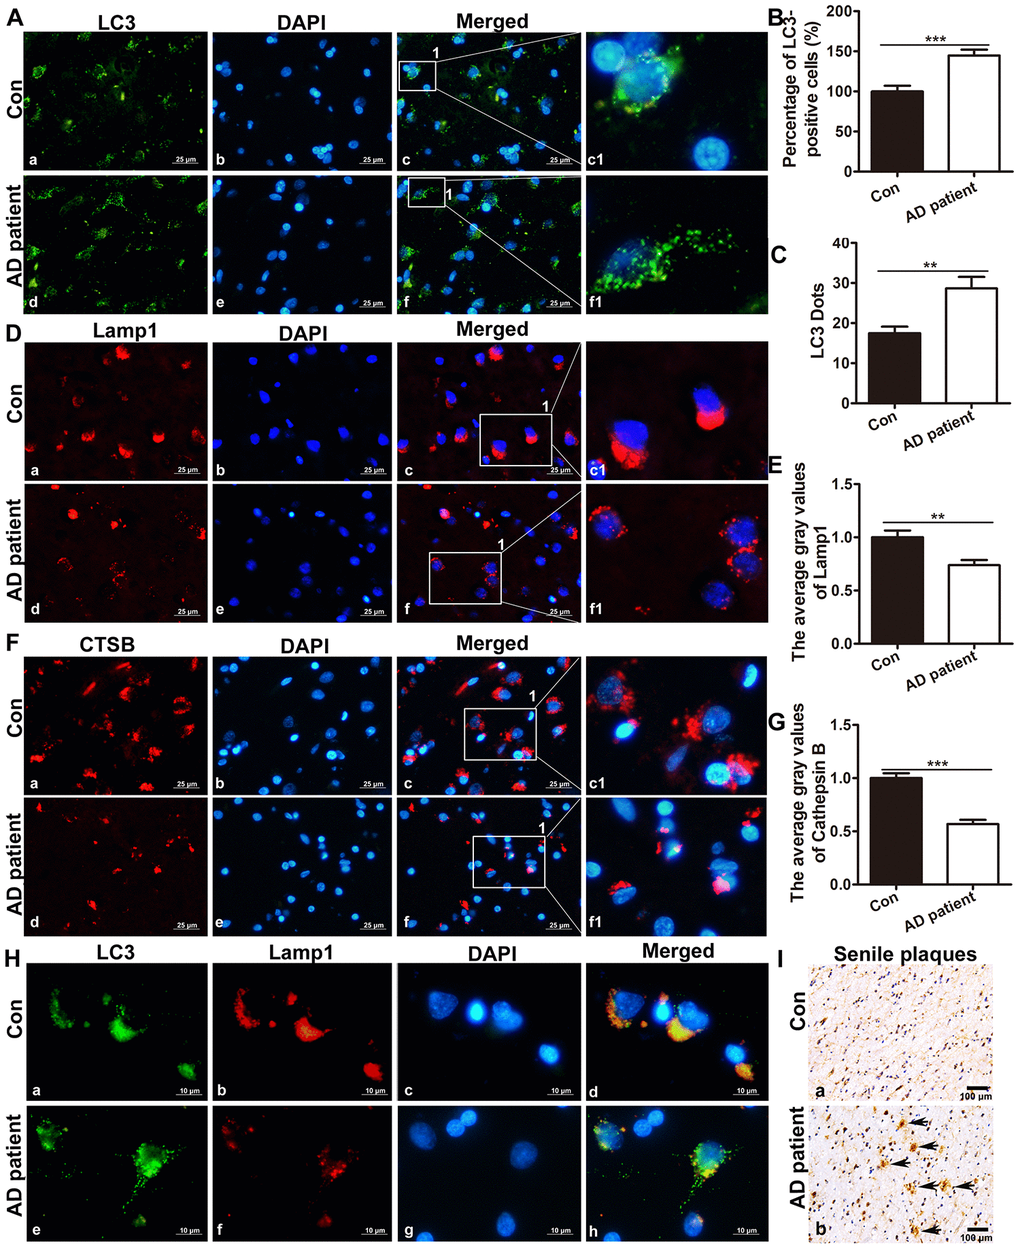
Figure 1.The expression of LC3, Lamp1 and CTSB in the brain of postmortem patients. (A) Immunofluorescence staining showed the expression of LC3 in the brain tissue of controls and AD patients (a, d: the expression of LC3; b, e: cell nuclei counterstained with DAPI; c, f: the merged images of Lamp1 and DAPI; c1 and f1 are partial magnifications of c and f. a-f: scale bar = 25 μm). (B) Quantitative analysis showing that the ratio of LC3-positive cells in the brain tissue. (C) Quantitative analysis showing the average LC3 puncta in brain tissue cells of AD patients and controls. (D) Immunofluorescence staining showing that the expression of Lamp1 in the brain tissue of controls (a-c1) and AD patients (d-f1). Scale bar = 25 μm. (E) Statistical analysis showing the average gray level of Lamp1. (F) Immunofluorescence staining showing that the expression of CTSB in the brain tissue of controls (a-c1) and AD patients (d-f1). Scale bar = 25 μm. (G) Statistical analysis showing the average gray level of CTSB. (H) Double immunofluorescence staining showing co-expression of autophagy- and lysosome-associated markers in the brain tissue of controls (a-d) and AD patients (c-f1). Scale bar = 10 μm. (I) Immunohistochemistry staining showing SPs in the postmortem cortexes of control patients (a) and AD patients (b), scale bar: 100 μm, the arrow indicates SP. The data are plotted as the mean ± SEM of three independent experiments and were analyzed by t test (**P < 0.01, ***P < 0.001 vs. control, n = 8).