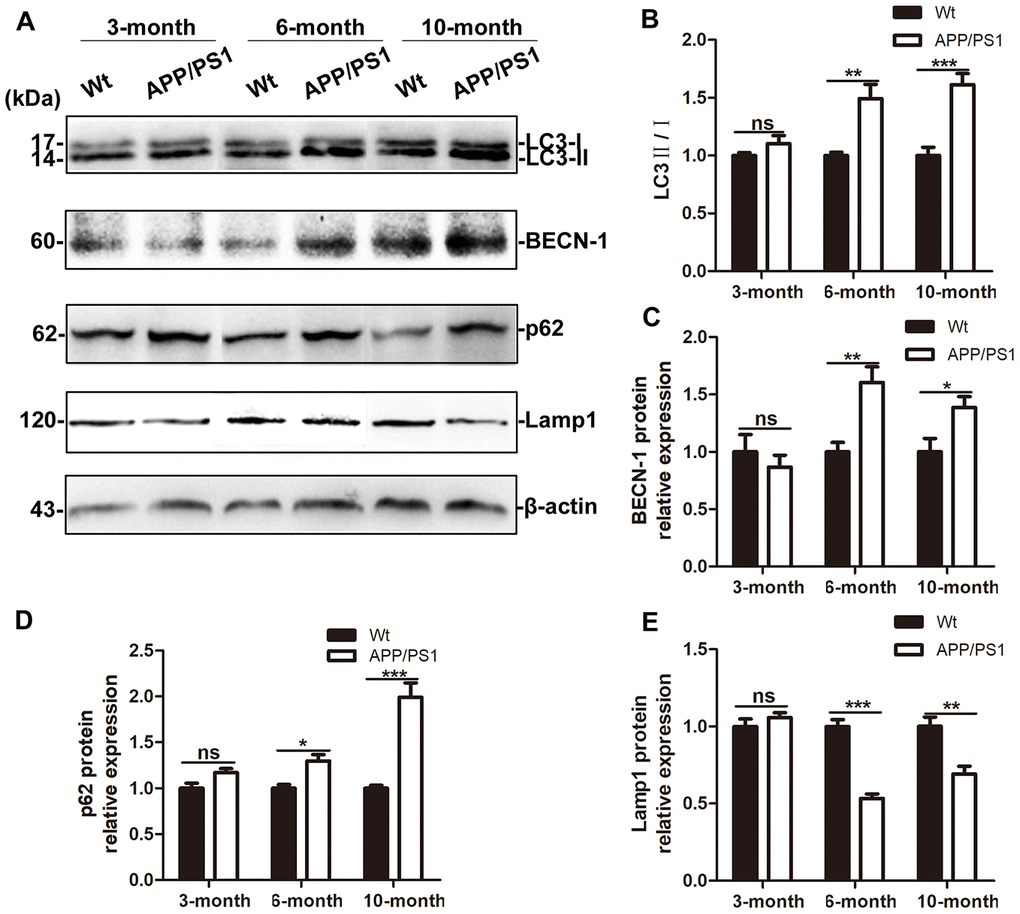
Figure 3.Autophagic flux in the brains of APP/PS1 DTg AD mice of ages. (A) Western blot showing LC3, BECN-1, p62 and Lamp1 expression in the brains of wild-type (Wt) and APP/PS1 DTg mice. (B–E) Relative gray density analysis of LC3-II/LC3-I, BECN-1, p62, and Lamp1 expression levels. The data are presented as the mean ± SEM and were analyzed by t test. (Compared with Wt mice, * P < 0.05, ** P < 0.01, *** < 0.001; “ns” denotes that there was no significant difference, n=3).