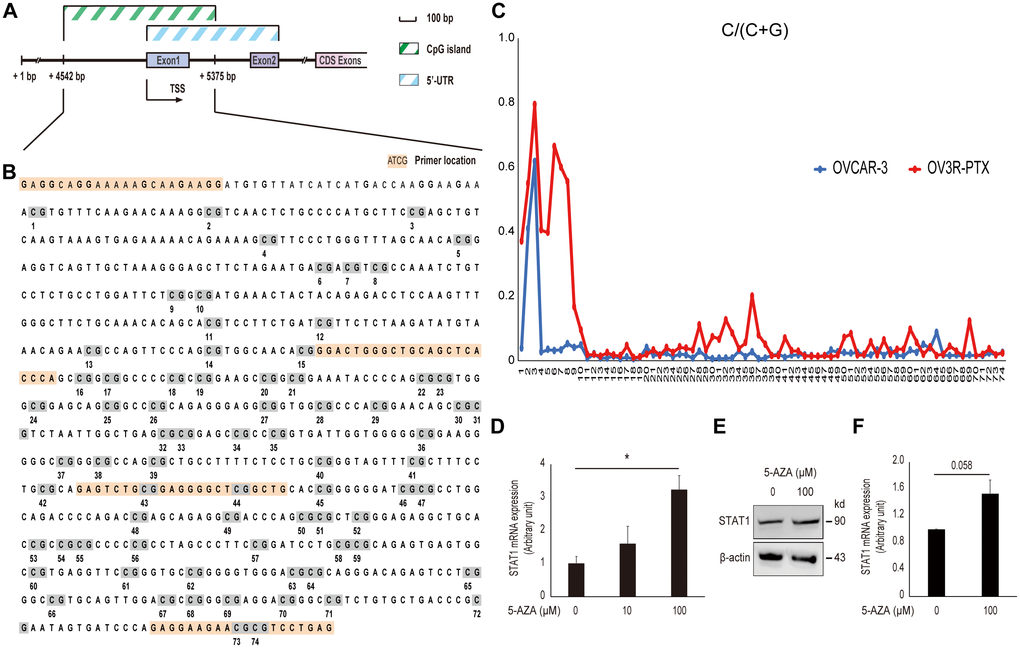
Figure 6.Effect of DNA methylation on STAT1 expression. (A) Schematic illustration of the STAT1 promoter region. The CpG island and 5’-untranslated region (UTR) are indicated. Numbers point the position of base pair (bp) in the sequence of GenBank (accession # NG_008294.1). CDS, coding sequence; TSS, transcription start site. (B) DNA sequence of CpG island in the STAT1 promoter region. The full-length CpG-rich promoter region was 834 bp in length. The primers used for MSP and DNA sequencing are highlighted in orange and CpG sites with numbers under the sequence are highlighted in grey. (C) Methylation level in a STAT1 promoter region detected by bisulfite sequencing. Each CpG site in the STAT1 promoter region was labeled on the horizontal axis (74 sites in total). The scale in the vertical axis represented the C to C+T ratio, which reflected the methylation level of the relevant CpG site. (D) STAT1 mRNA expression. OV3R-PTX cells were treated with 0, 10, and 100 μM 5-AZA, respectively, for 72 h. DMSO was used as a control. The mRNA level was detected by qRT-PCR. n = 3; *, P < 0.05. (E) STAT1 protein expression detected by Western blot after 100 μM 5-AZA for 72 h. β-actin was used as a loading control. Representative images of blotting are shown. (F) Semi-quantitative analysis of the relative optical density of protein bands in E. n = 3; *, P = 0.058.