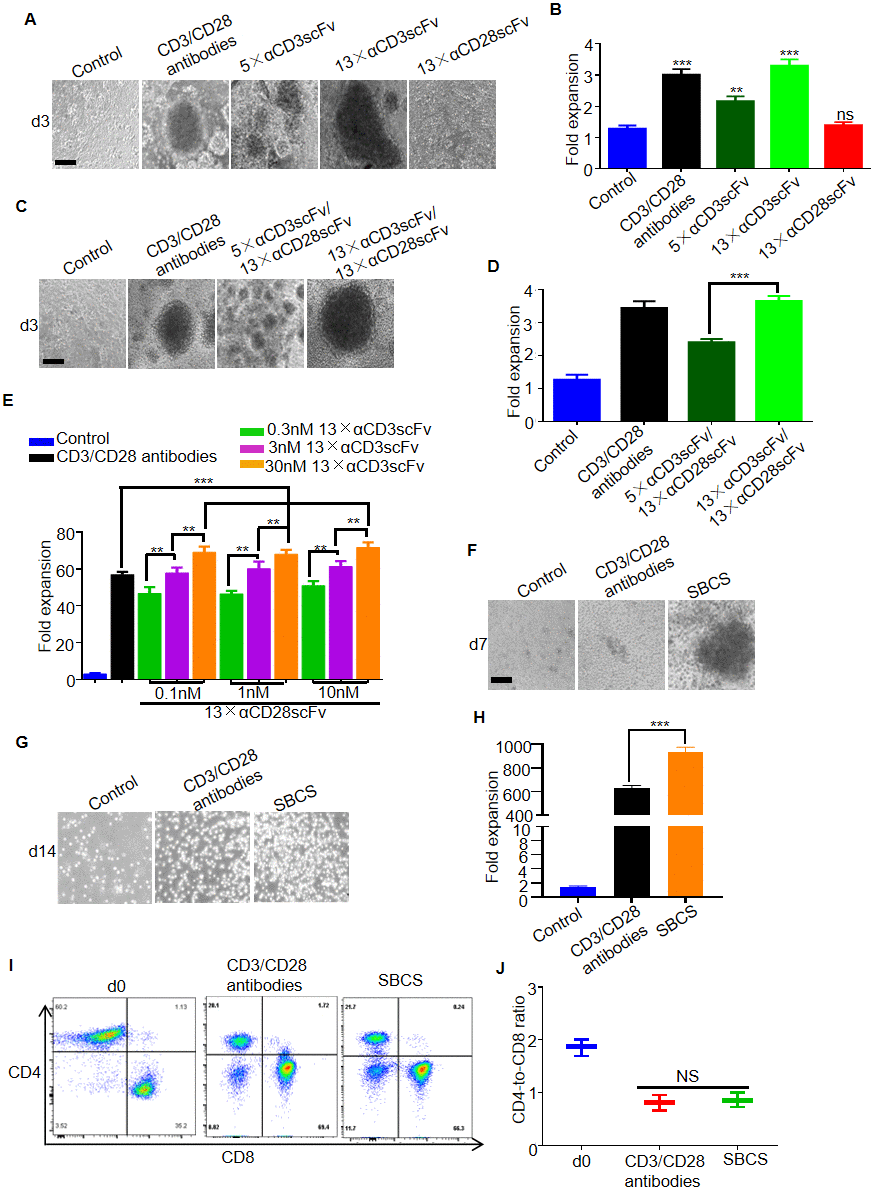
Figure 2.Expansion of T cells from healthy donors. (A) Representative bright-field microscope images of T cells after 3 days of treatment with immobilized CD3/CD28 antibodies, αCD3scFv, and αCD28scFv polymers at a concentration of 3 nM. The corresponding fold expansion of T cells is shown in (B). (C) Representative images of T cells after 3 days of treatment with the indicated antibodies or polymer compositions (3 nM 5×αCD3scFv/1 nM 13×αCD28scFv, or 3 nM 13×αCD3scFv/1 nM 13×αCD28scFv). The corresponding fold expansion of T cells is shown in (D). (E) Fold expansion of T cells after 7 days of treatment with immobilized CD3/CD28 antibodies or SBCS using different concentrations of 13×αCD3scFv and 13×αCD28scFv. (F) Representative images of the T cells cultured with immobilized CD3/CD28 antibodies or SBCS (30 nM 13×αCD3scFv/10 nM 13×αCD28scFv) at day 7. (G) Representative images of the T cells cultured with immobilized CD3/CD28 antibodies or SBCS at day 14. (H) Fold expansion of T cells after 14 days of treatment with immobilized CD3/CD28 antibodies or SBCS. (I, J) CD4-to-CD8 ratio of CD4+ and CD8+ single-positive cells among live cells after treatment with CD3/CD28 immobilized antibodies or SBCS for 14 days. ‘d0’ represents peripheral blood mononuclear cells before cell expansion. Data in B, D, E, H and J represent mean ± s.d. of n = 3 healthy donors and are representative of at least three independent experiments. ** P < 0.01, *** P < 0.001. ns, not significant. Scale bars = 100 μm.