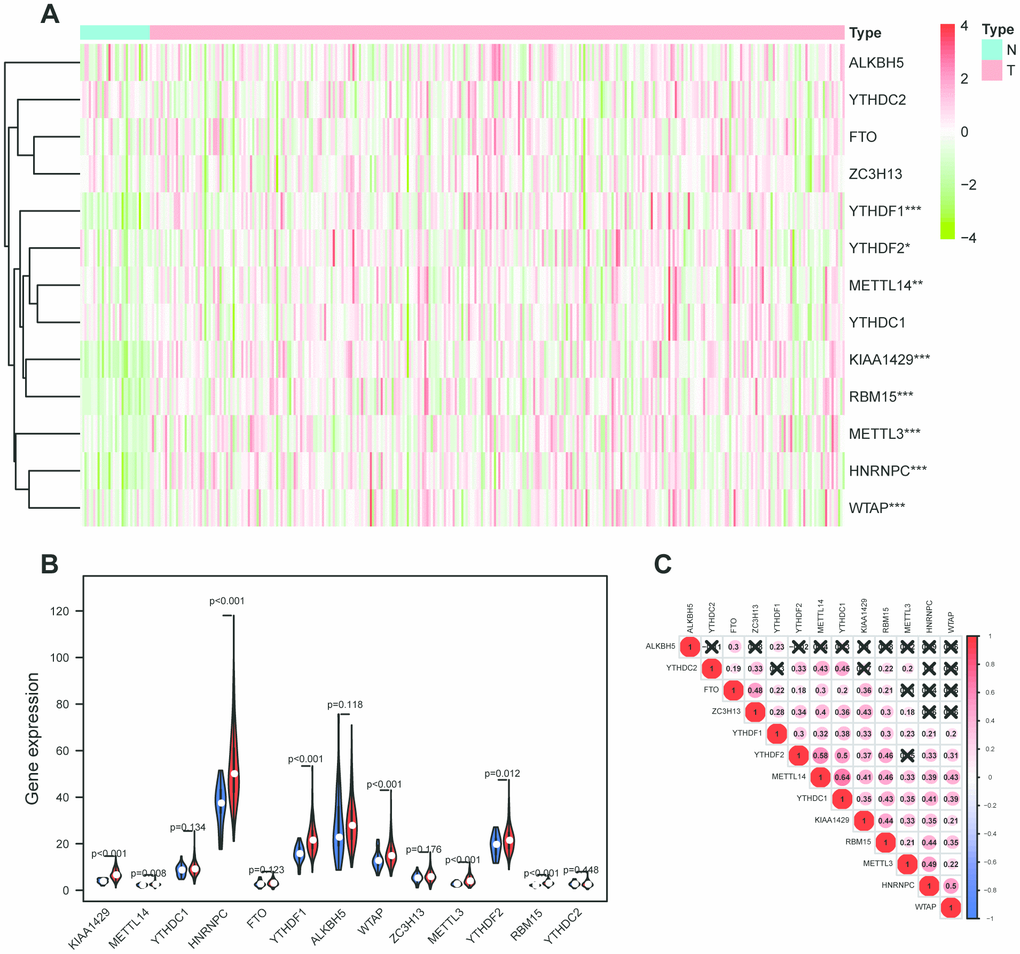
Figure 1.M6A-related genes expression level and correlation in OSCC. (A) 317 OSCC samples and 32 normal control m6A expression level on basis of TCGA database. N stands for normal control, while T represents tumor samples. Differences were considered significant at p <0.05 *; p <0.01**; p <0.001***.The ascending normalized expression level in the heatmaps is colored from green to red. (B) Differently expressed analysis of 13 m6A related genes. Blue stands for normal control, while red OSCC samples. (C) The correlation between 13 m6A related genes. The ascending normalized correlation level in the picture is colored from blue to red.