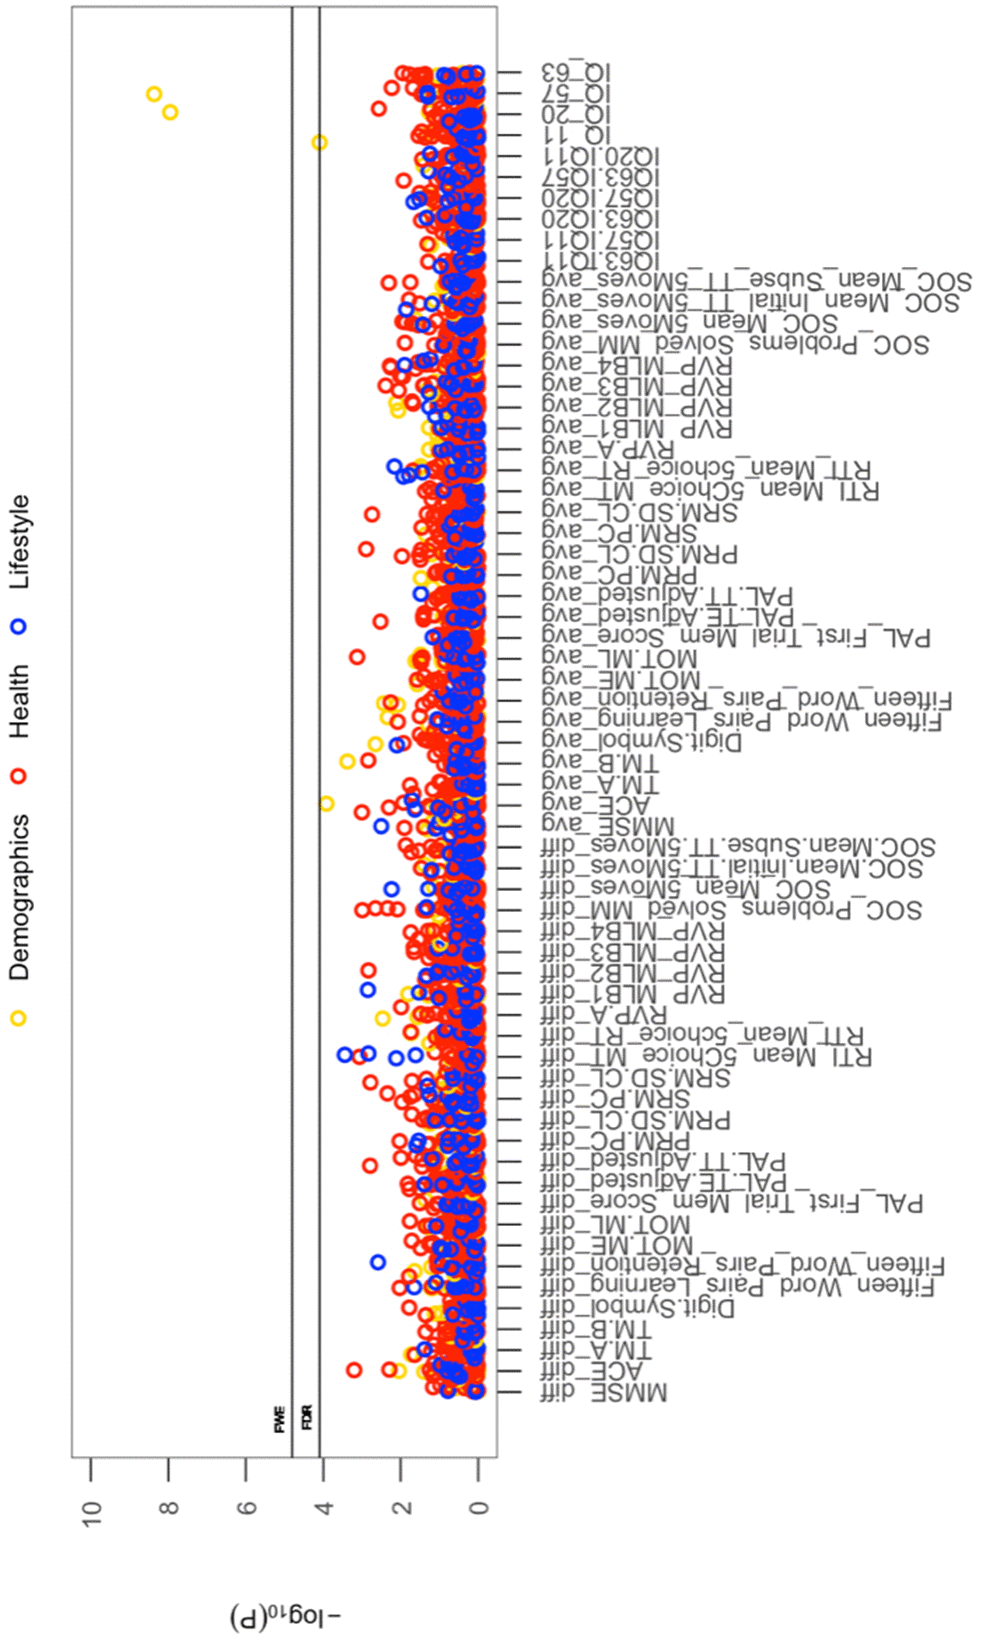
Figure 2.The significance of associations between each longitudinal/average cognitive measure and all (other) cross-sectional behavioural variables. The Manhattan plot shows all results for 64 cognitive variables against each of the 50 (other) behavioural variables (3200 values) adjusted for confounders: age, motion, and head size. Significance is plotted as -log 10 p-values, arranged by cognitive variables on the x-axis, multiple testing thresholds across all pairwise associations are marked with a horizontal line, FWE top line (4.80 x 10⁻⁴) and FDR bottom line (4.09 x 10⁻⁴). All other behavioural variables are distinguished by plotting colour (Demographic = yellow, Health = red, Lifestyle = blue). Abbreviations: IQ-11, IQ-20, IQ-57, IQ-63 = general intelligence score at ages ~11, ~20, ~57, and ~63; MOT = motor task; ME = mean error; ML = mean latency; PAL = paired associates learning; TE adjusted = total errors adjusted; TT Adjusted = total trials adjusted; PRM = pattern recognition memory; SD = standard deviation; CL = correct latency; RTI = reaction time task; MT = movement time; RT = reaction time; RVP = rapid visual processing task; MLB1-4 = mean latency block 1 to 4; SOC = Stockings of Cambridge; Mean Initial TT 5 Moves = mean initial total time 5 moves task; Mean Subse TT 5 Moves = mean subsequent thinking time 5 moves task; SRM = spatial recognition memory; TM = trail making task).