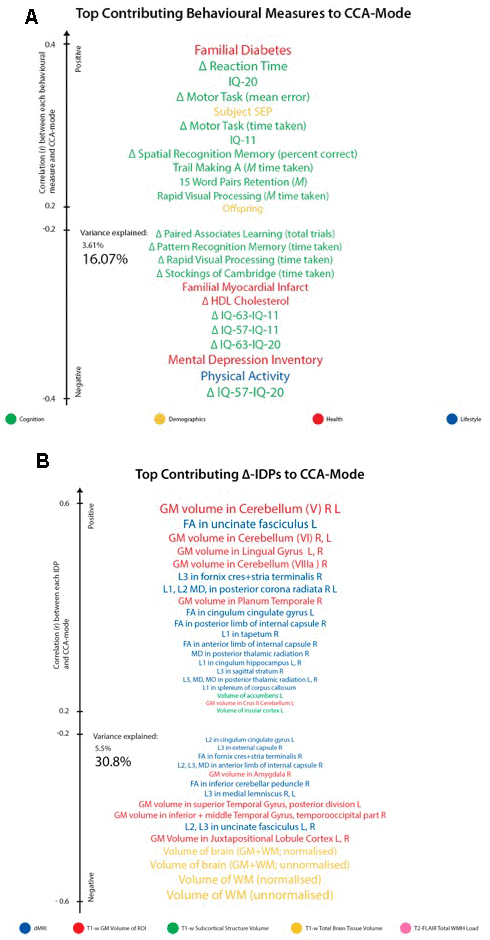
Figure 3.Top contributing variables to identified CCA-Mode using post-hoc correlational analyses. Individual behavioural (A) and IDP (B) measures most strongly associated with the CCA-mode of population covariation. The CCA-derived weights visualized indicate how much each measured variable contributes to the significant CCA-mode i.e., the measure of the strength of involvement of an observed variable to the CCA-mode, derived from post-hoc correlational analyses. Behavioural measures and IDPs are coloured according to their assigned subdomains. The vertical position of each variable is related to the scale of the association of that specific measure with the identified CCA-mode. Font size is indicative of variance explained by the CCA-mode. Here we do not report variables that attain a correlation value between 0.2 to -0.2. Abbreviations: Δ = longitudinal change (W-63 – W-57), M = average ((W-63 + W-57)/2), L = left, R = right, FA = fractional anisotropy, L1 = 1st eigenvalue, L2 = 2nd eigenvalue, L3, = 3rd eigenvalue, MD = mean diffusivity, MO = tensor mode.