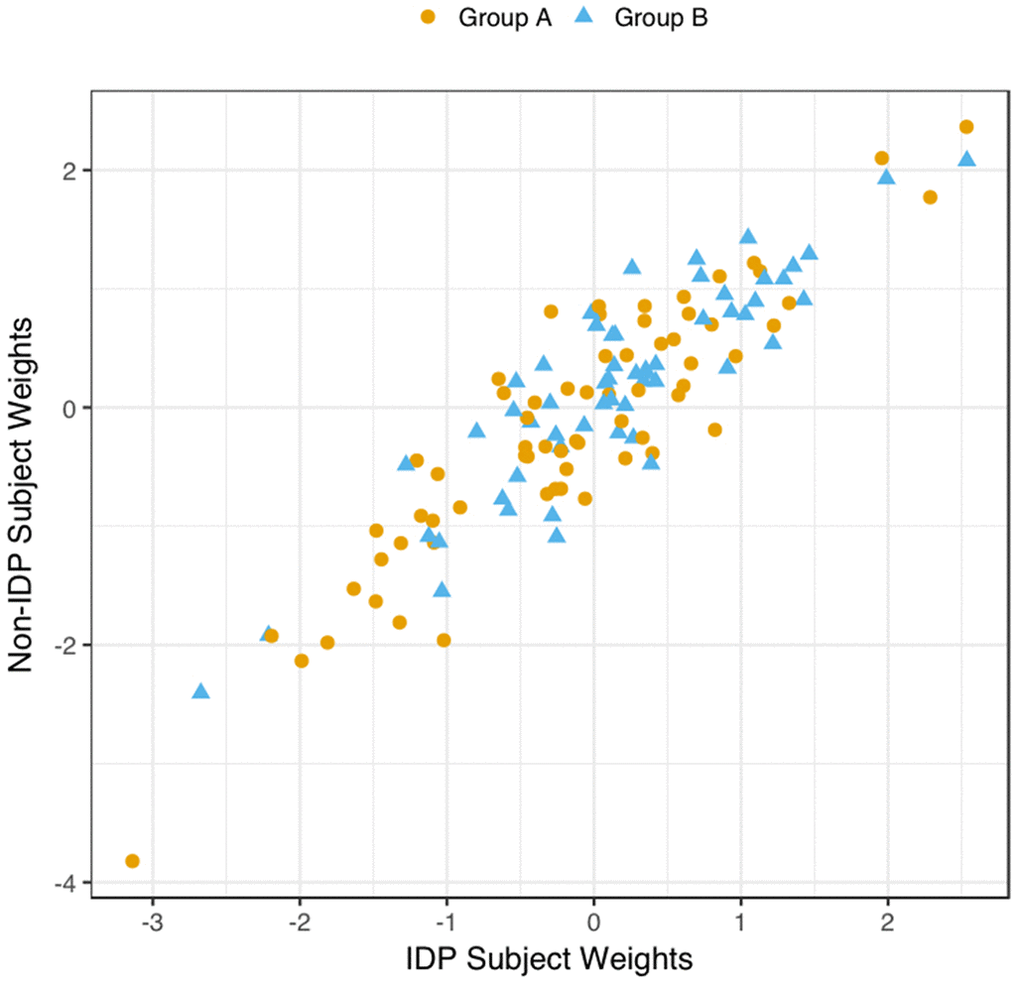
Figure 4.Scatter Plot of all Subject’s Relationship with the Significant CCA-Mode. The scatter plot shows the association between individual subject weights from the IDP canonical variate (V) versus individual subject weights from the behavioural canonical variate (U), with one point per subject. The high correlation observed here reflects the significant covariation between the behavioural and imaging longitudinal datasets. Group membership is indicated by plotting symbol (orange circle = group A i.e. improvers; blue triangle = group B i.e. decliners).