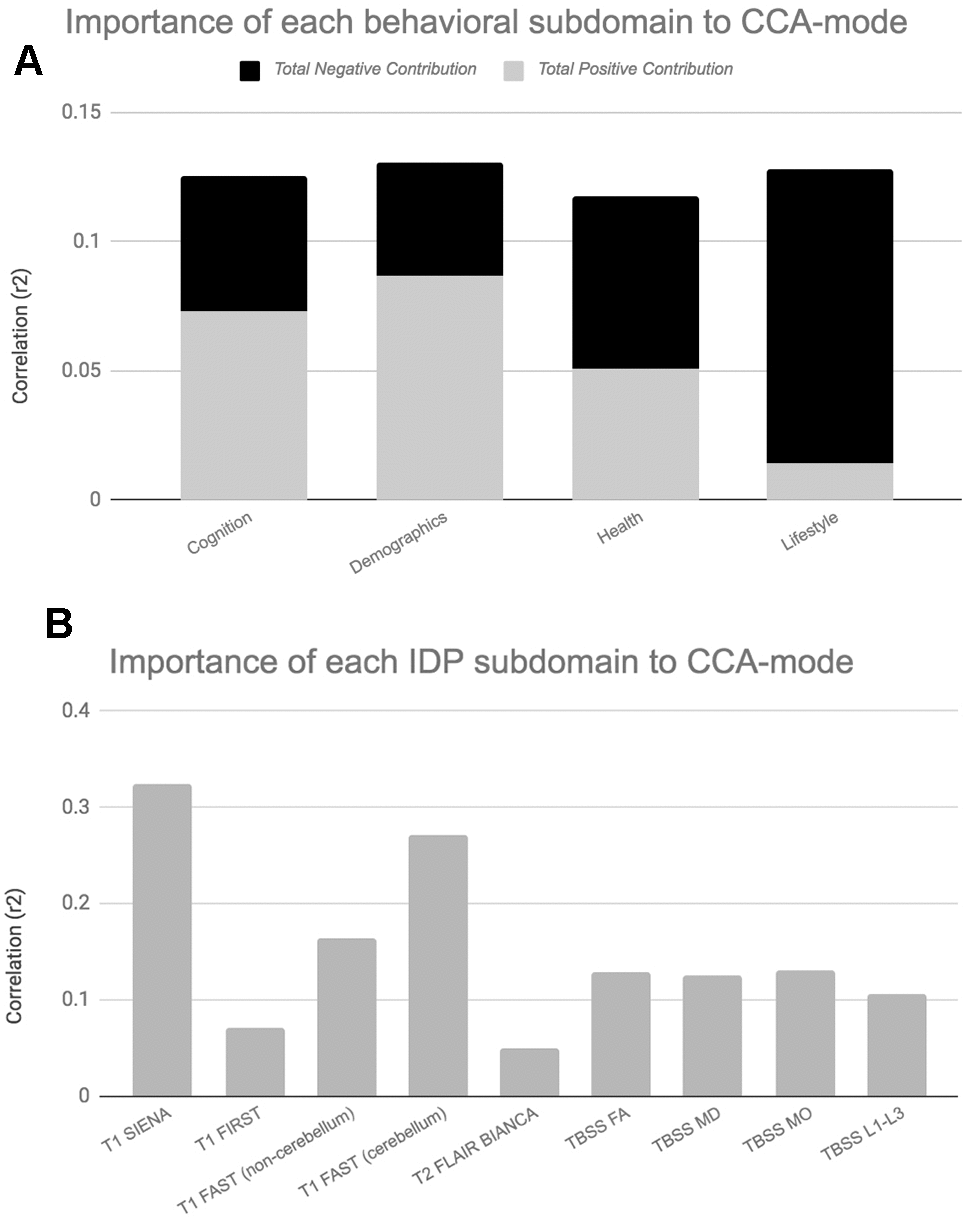
Figure 5.Importance of Behavioural and Brain-Imaging Subdomains to the CCA-Mode.Figures 5A, 5B visualize the overall significance of behavioural (A) and IDP subdomains (B) in influencing multivariate associations between each variable included in the measurement battery. For each subdomain (x-axis), the length of each bar represents the average subdomain importance (r2) to the CCA-mode. For behavioural subdomains only, categorically-driven contributions from positive qualities or indicators are represented in grey, whilst contributions from negative traits are represented in black. For brain-imaging subdomains all contributions are shown in grey as interpretation of the direction of longitudinal change observed in brain biomarkers was avoided due to the associated uncertainty. In this study, individual measures describing whole brain tissue volume (SIENAX and SIENA) and demographics were identified as the most important contributors to the CCA-mode of population covariation. Abbreviations: FA = fractional anisotropy, L1 = 1st eigenvalue, L2 = 2nd eigenvalue, L3, = 3rd eigenvalue, MD = mean diffusivity, MO = tensor mode, FAST = FMRIB’s Automated Segmentation Tool, FLAIR = Fluid-Attenuated Inversion Recovery, BIANCA = Brain Intensity AbNormality Algorithm, TBSS: tract-based spatial statistics.