Submit an Article
Navigate
Home
Editorial Board
Editorial Policies
Current Volume
Archive
Scientific Integrity
Publication Ethics Statements
Interviews with Outstanding Authors
Newsroom
Sponsored Conferences
Podcast
Contact
Special Collections
Submit an Article
Online ISSN: 1945-4589
Research Paper
|
Volume 12, Issue 17
|
pp. 16709–16743
Discovering correlates of age-related decline in a healthy late-midlife male birth cohort
Back to article
Figure 7
(7 of 8)
−
100%
+
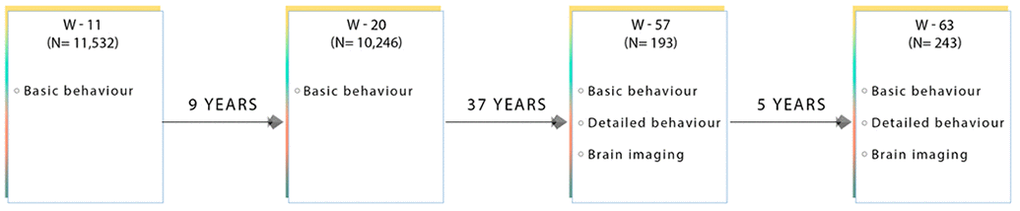
Figure 7.
Flow diagram showing the data collected at each time point for subjects used in this present sub-study.
W-11, W-20, W-57, and W-63 = data acquired at ages ~11, ~20, ~57 and ~63 respectively.