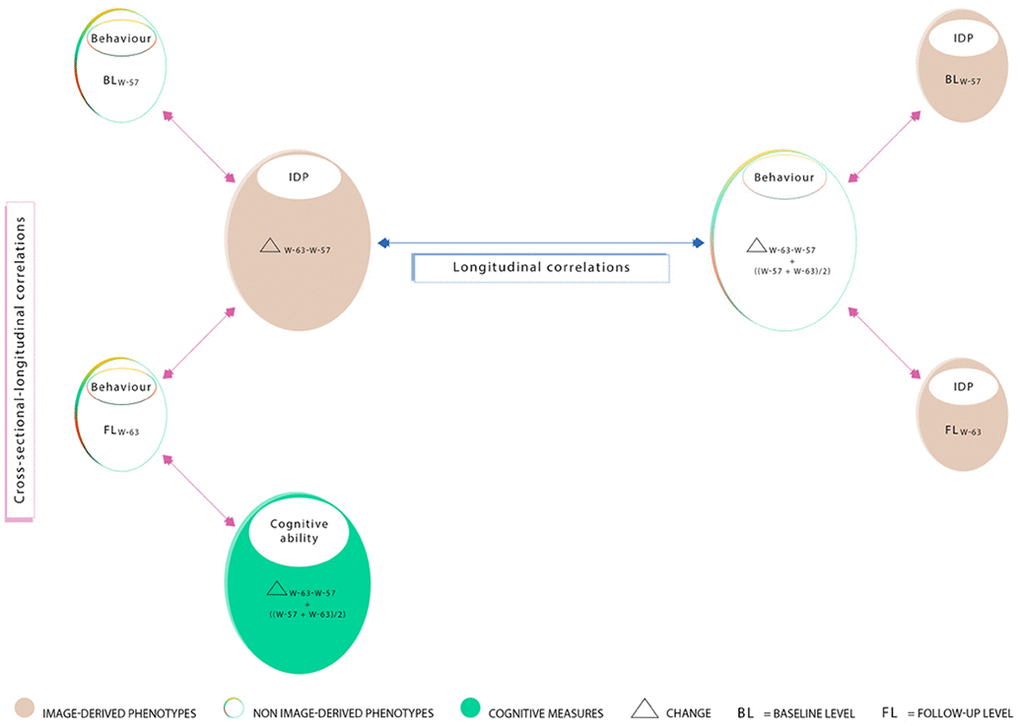
Figure 8.Summary of correlations computed between measures acquired at W-57 (baseline; BLW-57), W-63 (follow-up, FLW-63), their differences i.e. change (ΔW-63-W-57), and average ((ΔW-57+W-63)/2). Measured brain-imaging and behavioural variables from W-57 and W-63 are represented by smaller-sized ovals (1a-1d). Measures of change estimated using the difference between W-63 and W-57 and their averages are represented by larger-sized ovals (2a-2c). Ovals 1a and 1b represent 70 cross-sectional behavioural items and ovals 1c and 1d represent 453 cross-sectional IDPs. Ovals consisting of longitudinal variables (i.e. change and/or average scores) include 454 IDPs (2a), 114 behavioural items (2b), and 60 cognitive items (2c). In this study, we explore “cross-sectional longitudinal correlations” (pink arrows), and “longitudinal correlations” (blue arrow) using univariate and multivariate analyses. All correlations were adjusted for nuisance confounders motion (during MRI), age, and head size.