Submit an Article
Navigate
Home
Editorial Board
Editorial Policies
Current Volume
Archive
Scientific Integrity
Publication Ethics Statements
Interviews with Outstanding Authors
Newsroom
Sponsored Conferences
Podcast
Contact
Special Collections
Submit an Article
Online ISSN: 1945-4589
Research Paper
|
Volume 12, Issue 12
|
pp. 11864–11877
Prognosis and regulation of an adenylyl cyclase network in acute myeloid leukemia
Back to article
Figure 2
(2 of 7)
−
100%
+
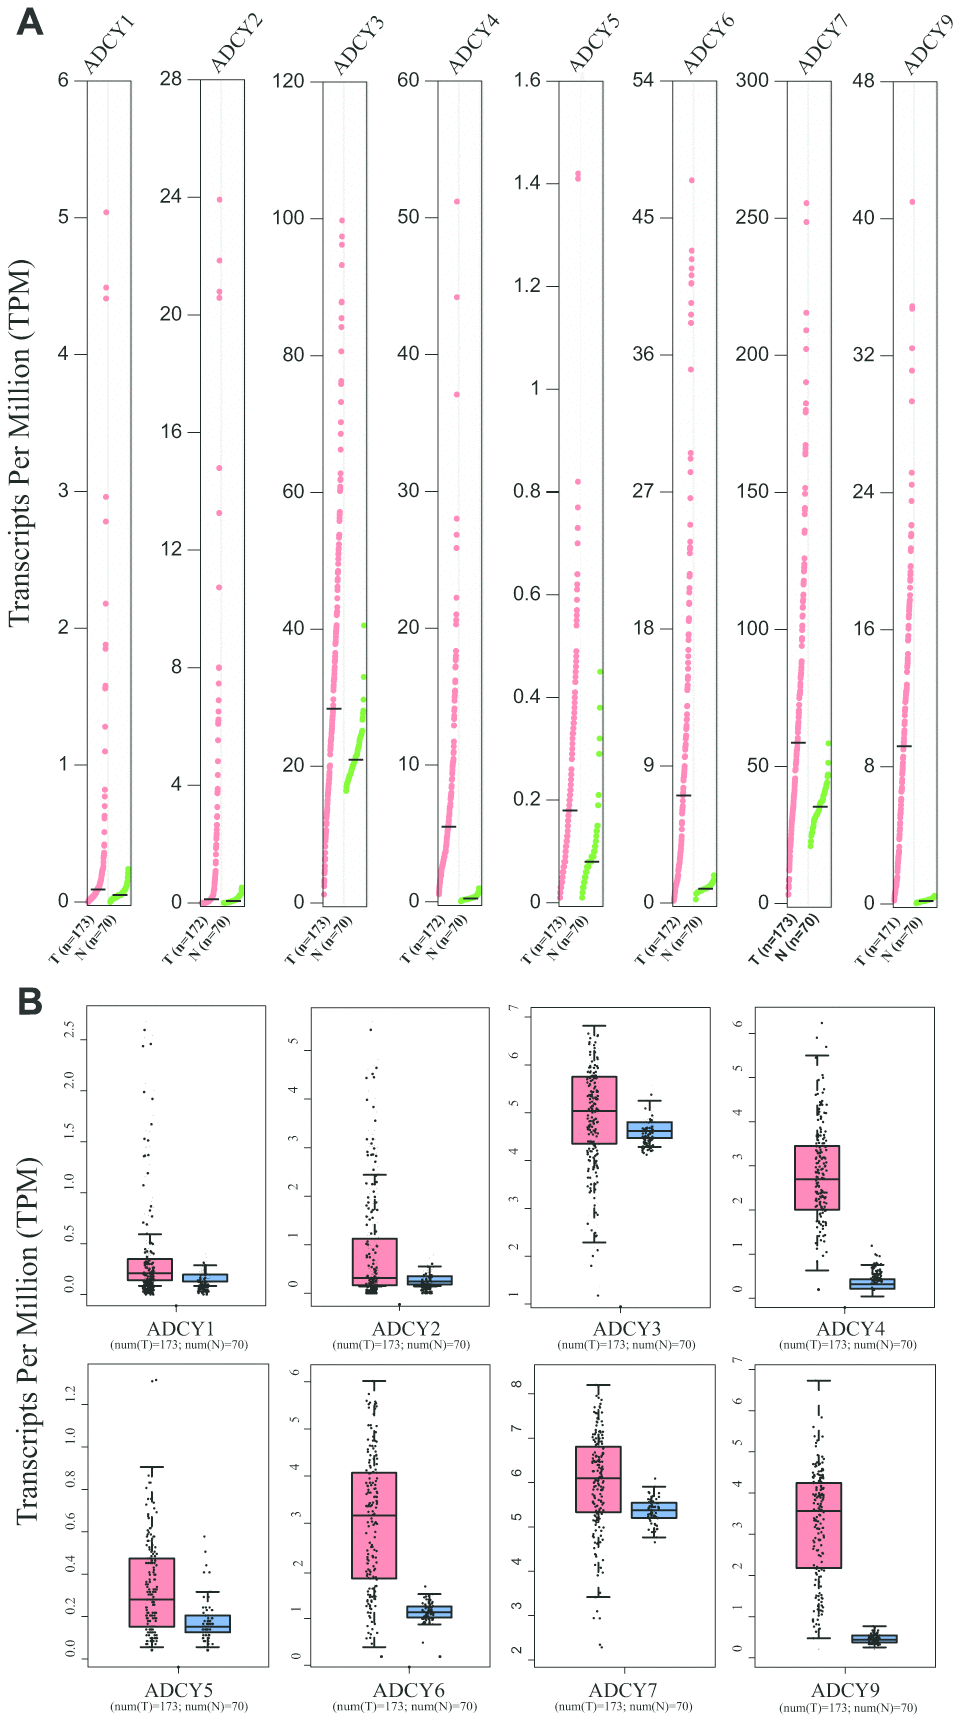
Figure 2.
Expression of ADCYs in AML and normal samples (GEPIA).
(
A
) The expression levels of ADCYs in AML compared with normal samples. (
B
) The TPM values of ADCYs in AML and normal samples. T represents AML samples and N represents normal samples.