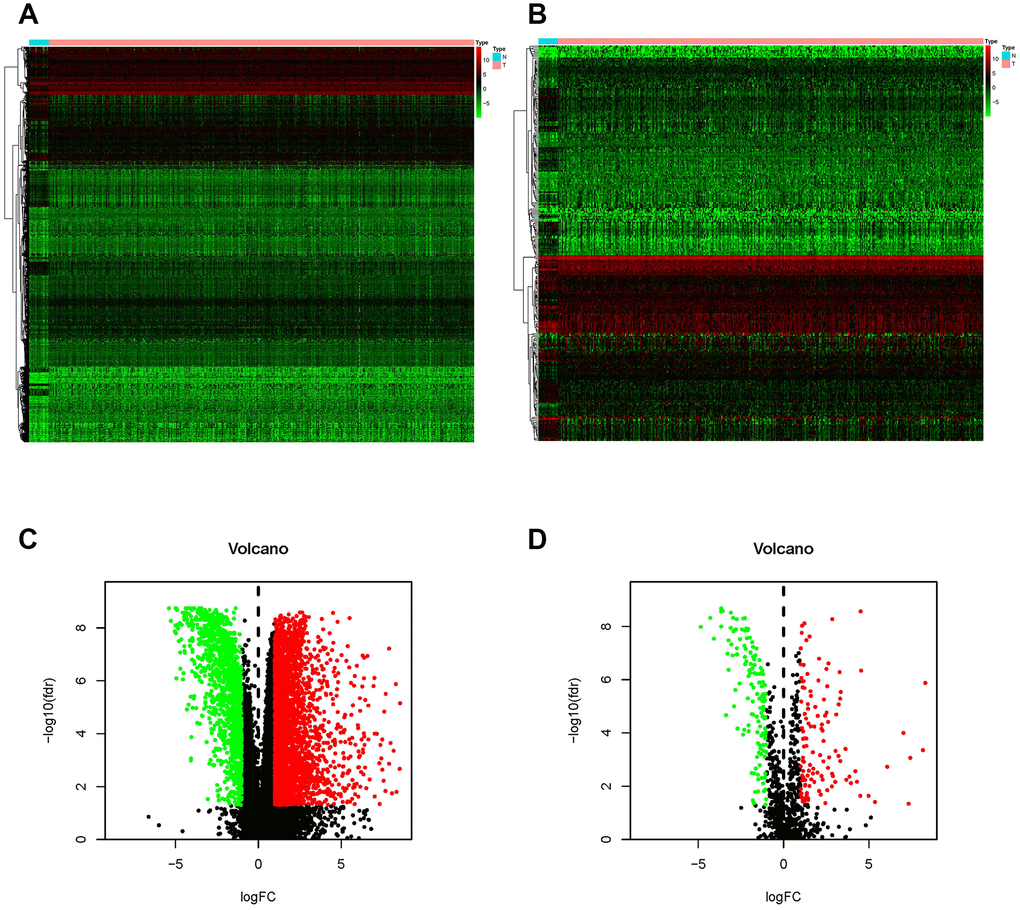
Figure 1.Differentially expressed BCa genes and IFRGs. Heatmap (A) and volcano plot (C) show the differentially expressed genes between BCa tissues and nontumor tissues. The black dots represent genes without differential expression; the red dots represent the significantly upregulated genes, and the green dots represent downregulated genes. FDR < 0.05, log2 | FC | >1 and P < 0.05. Immune function-related genes (IFRGs) with various expression levels are illustrated in the heatmap (B) and volcano plot (D). The black dots represent IFRGs without differential expression; the red dots represent upregulated IFRGs, and the green dots represent downregulated IFRGs. FDR < 0.05, log2 | FC | >1 and P < 0.05.