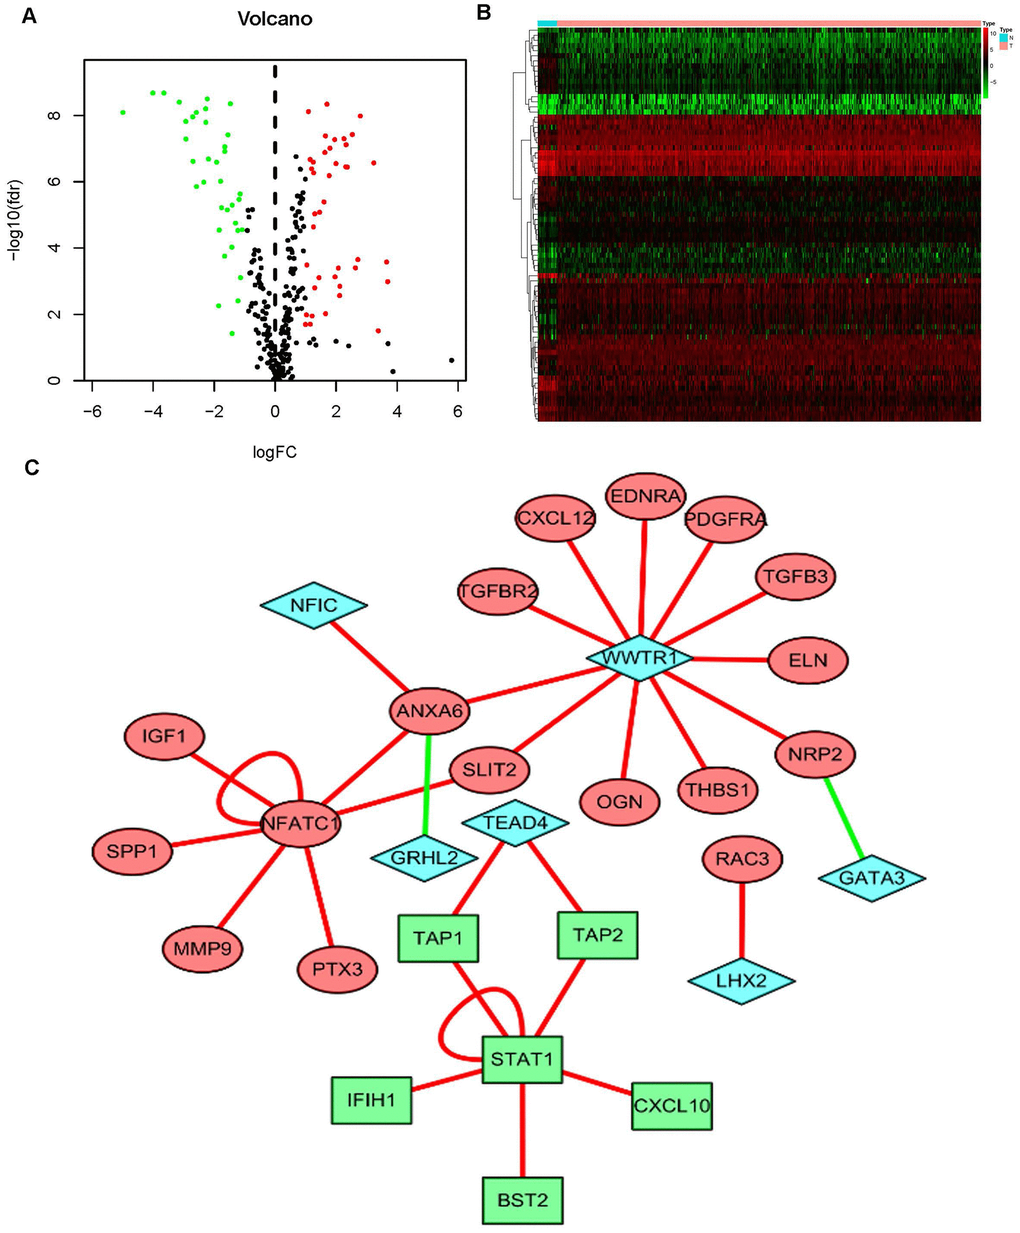
Figure 5.The mediated relationships between sIFRGs and differentially expressed transcription factors. Volcano plot (A) and heatmap (B) showing the differentially expressed transcription factors (TFs). The black dots represent TFs without differential expression; the red dots represent upregulated TFs, and the green dots represent downregulated TFs. FDR < 0.05, log2 | FC | >1 and P < 0.05. The regulatory network (C) was composed of relevant TFs and sIFRGs. The red circles represent upregulated sIFRGs, the green rectangles represent downregulated sIFRGs, and the blue rhombuses represent relevant TFs. The red lines represent positive regulation, and the green lines represent negative regulation.