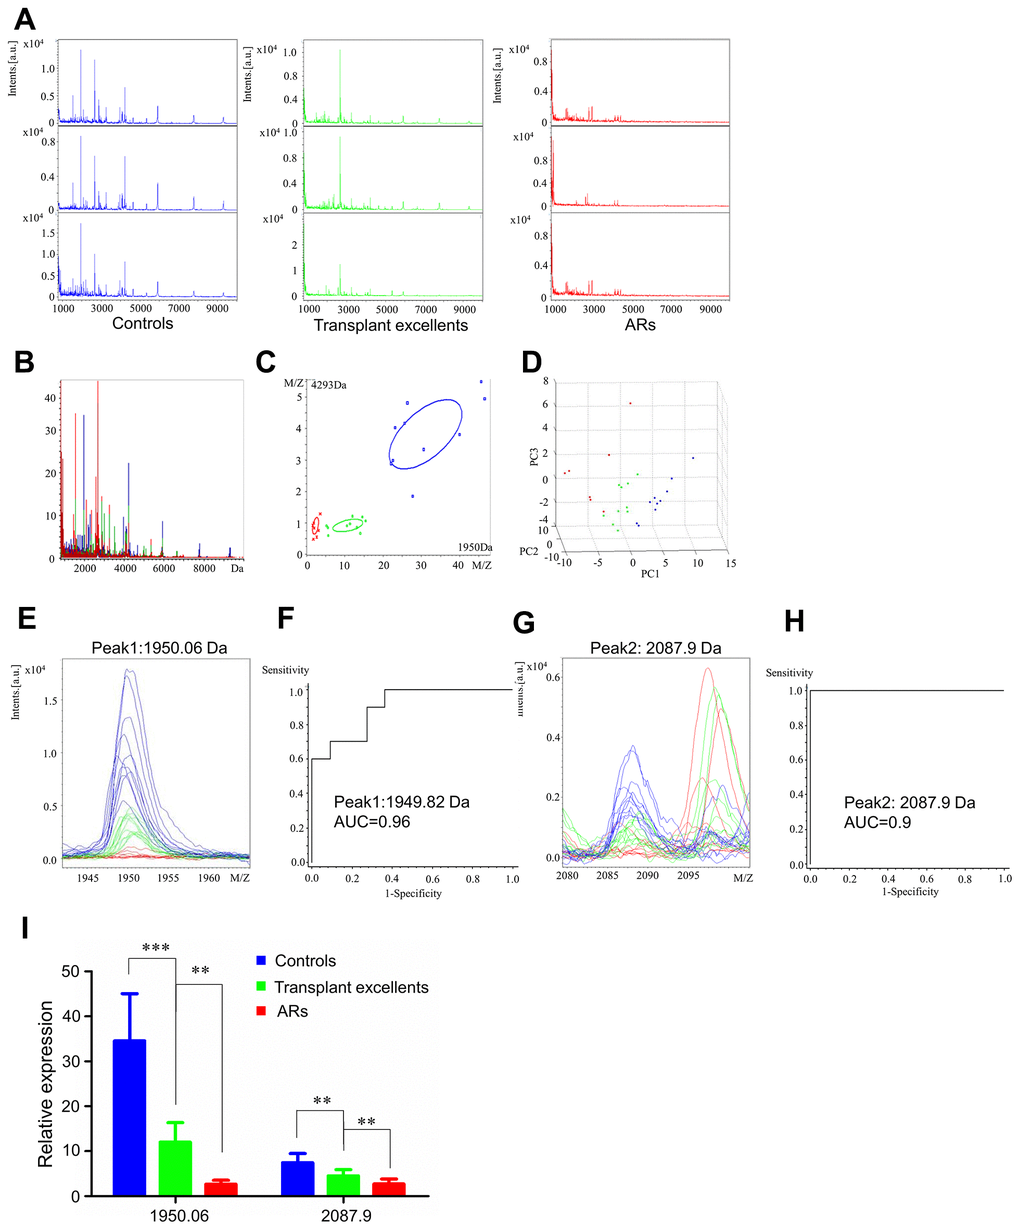
Figure 3.Serum proteomic profiling analysis for AR group, healthy controls (blue), transplant excellent patients (green) and AR patients (red). (A) Representative mass spectra of three samples in healthy controls, transplant excellent patients and AR patients in the mass range from 1000 to 10,000 Da. (B) Overall sum of the spectra in the mass range from 1000 to 10,000 Da obtained from AR group described above. (C) Bivariate plot of AR group with the most differentiated two peaks (m/z: 4293, 1950). (D) 3D plot of AR group. (E, G) Comparison of the spectra of two peaks in healthy controls, transplant excellent patients and AR patients. (F, H) ROC curves for two selected peaks with their AUC values. (I) Average expression levels of two selected peaks in healthy controls, transplant excellent patients and AR patients and their respective p-values. Values are expressed as mean ± SD. (***p < 0.001, **p < 0.01, *p < 0.05).