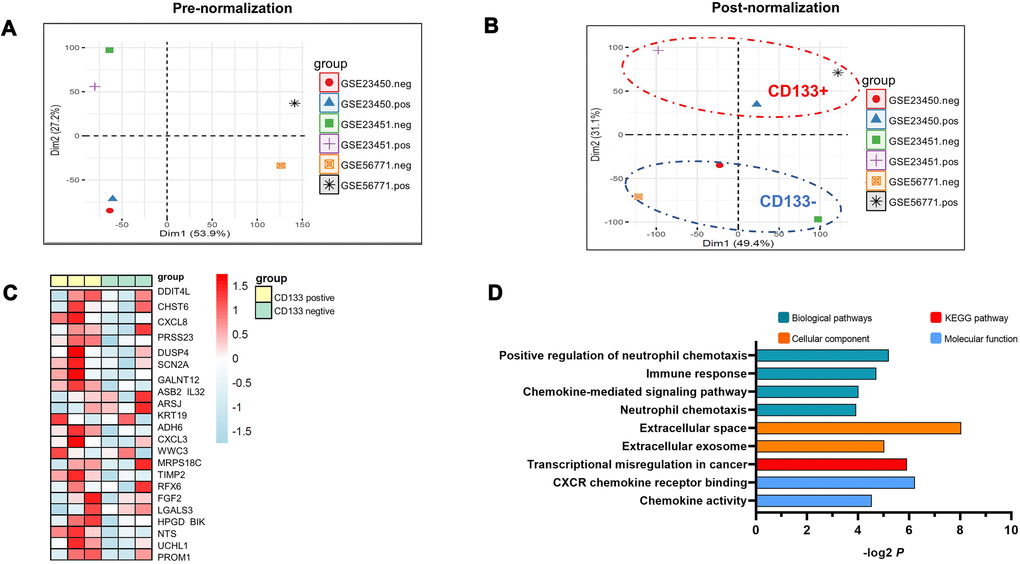
Figure 1.PCA analysis of three RNA sequencing datasets compared to the differential gene expression between CD133+ liver CSCs and CD133- differentiated counterparts. (A) Data representing the clustering information of independent samples. The analysis was based on the expression of all genes for each individual sample. (B) Data representing the clustering information of independent samples after removing batch effects. The ellipses indicate group dispersion/variability from the centroid. CD133-positive groups are shown in the red ellipse, and CD133-negative groups are displayed in the blue ellipse. Two main components (PCA1/PCA2) of PCA were applied to the normalized differences to find the largest correlated variables. (C) Hierarchical cluster heatmap analysis of gene expression profiles in CD133+ liver CSCs vs. CD133- liver CSCs. Each cell in the matrix represents a particular expression level, where the colors (white/green to pink/red) indicate lower to higher gene expression levels. The bars at the top of each column indicate the following: Yellow=CD133-positive group; green = CD133-negative group. At the bottom, from left to right, each column represents the sample name of the GEO dataset. (D) Pathway enrichment analysis of CD133+ liver CSCs. P values (–log2 transformed) are plotted for each enriched functional category. Abbreviations: PCA: principal component analysis; CD133+, CD133-positive groups; CD133-, CD133-negative groups.