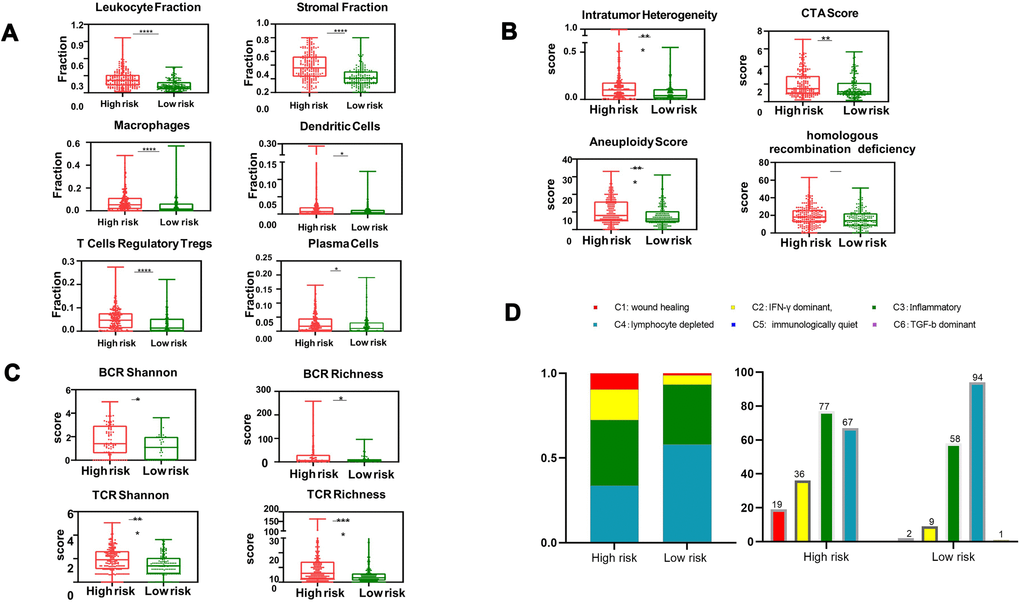
Figure 6.Box and whisker chart showing the aberrant elevation of the tumor immune infiltrate in high-risk patients. (A) The proportion of major classes of immune cells. (B) BCR (top) and TCR (bottom) diversity measured by the Shannon entropy and species richness. (C) Four key immune expression signature scores. (D) Number of patients and distribution of immune subtypes in the high-risk and low-risk groups. The text above the bars shows the specific number of patients in each immune subtype. The bar width reflects the number of tumor samples; the six immune subtypes include C1 (wound healing), C2 (IFN-γ dominant), C3 (inflammatory), C4 (lymphocyte depleted), C5 (immunologically quiet) and C6 (TGF-b dominant); values from min to max are plotted.