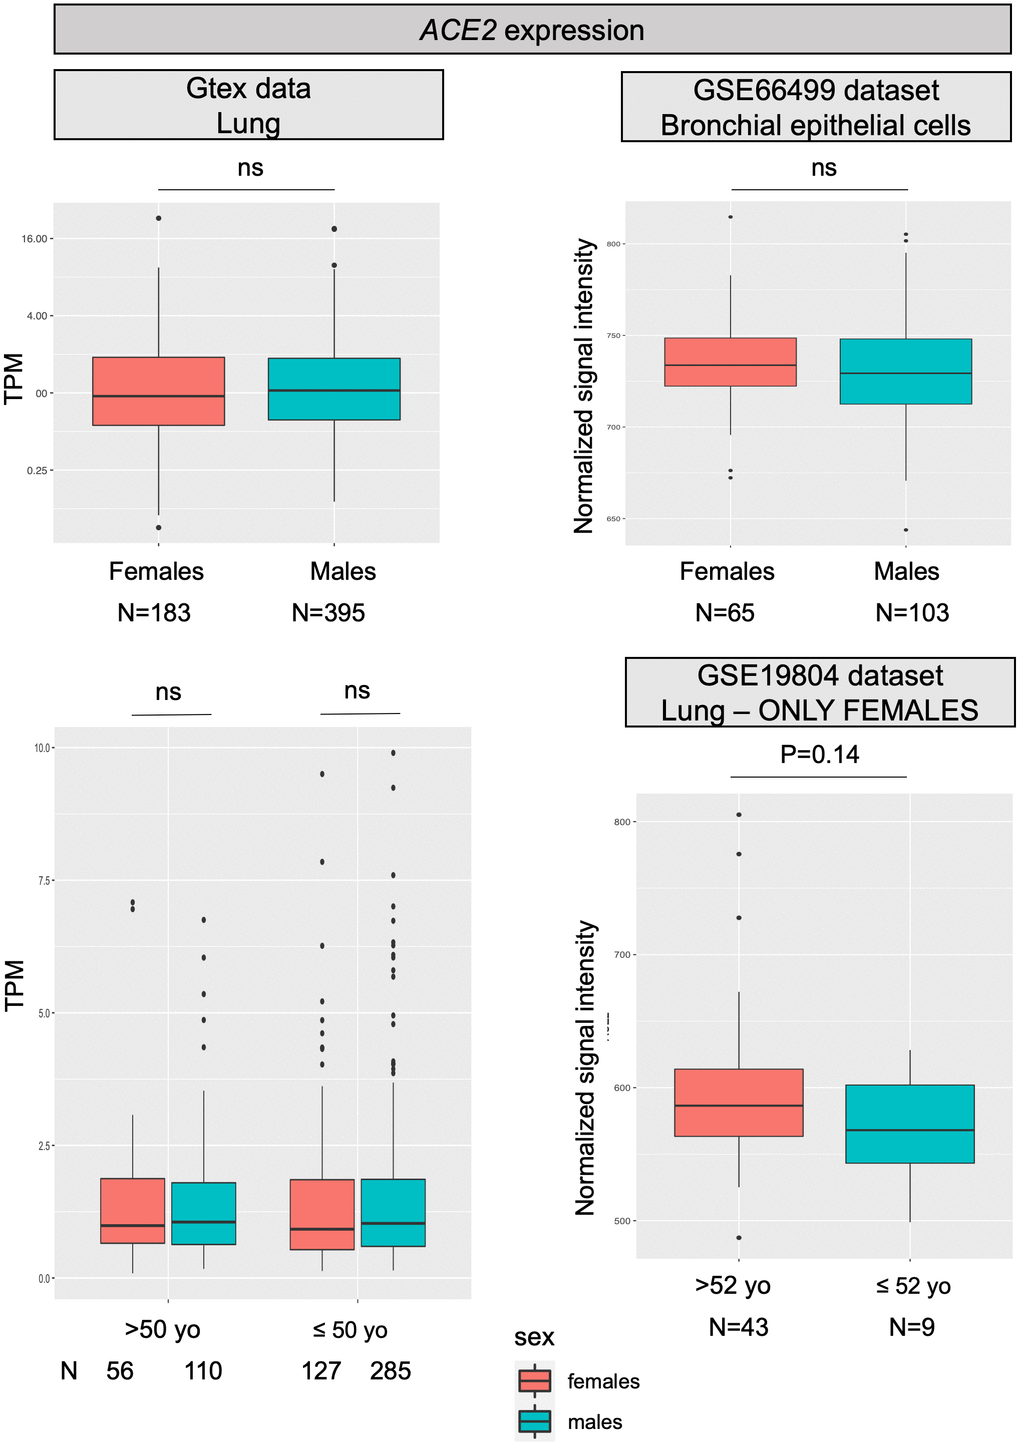
Figure 1.ACE2 expression levels. All panels show ACE2 mRNA expression levels in human normal lung samples stratified according to sex (or on sex and age). On left panels, data were retrieved for a total of 578 RNAseq experiments from the GTex repository. Expression levels are reported as transcripts per kilobase million (TPM). On the right, data were collected from two different datasets (GSE66499 and GSE19804) from the GEO database. Expression levels are reported as normalized signal intensities. P values were calculated by using either the Kruskal-Wallis or the student t test, using the R software (https://www.r-project.org/).