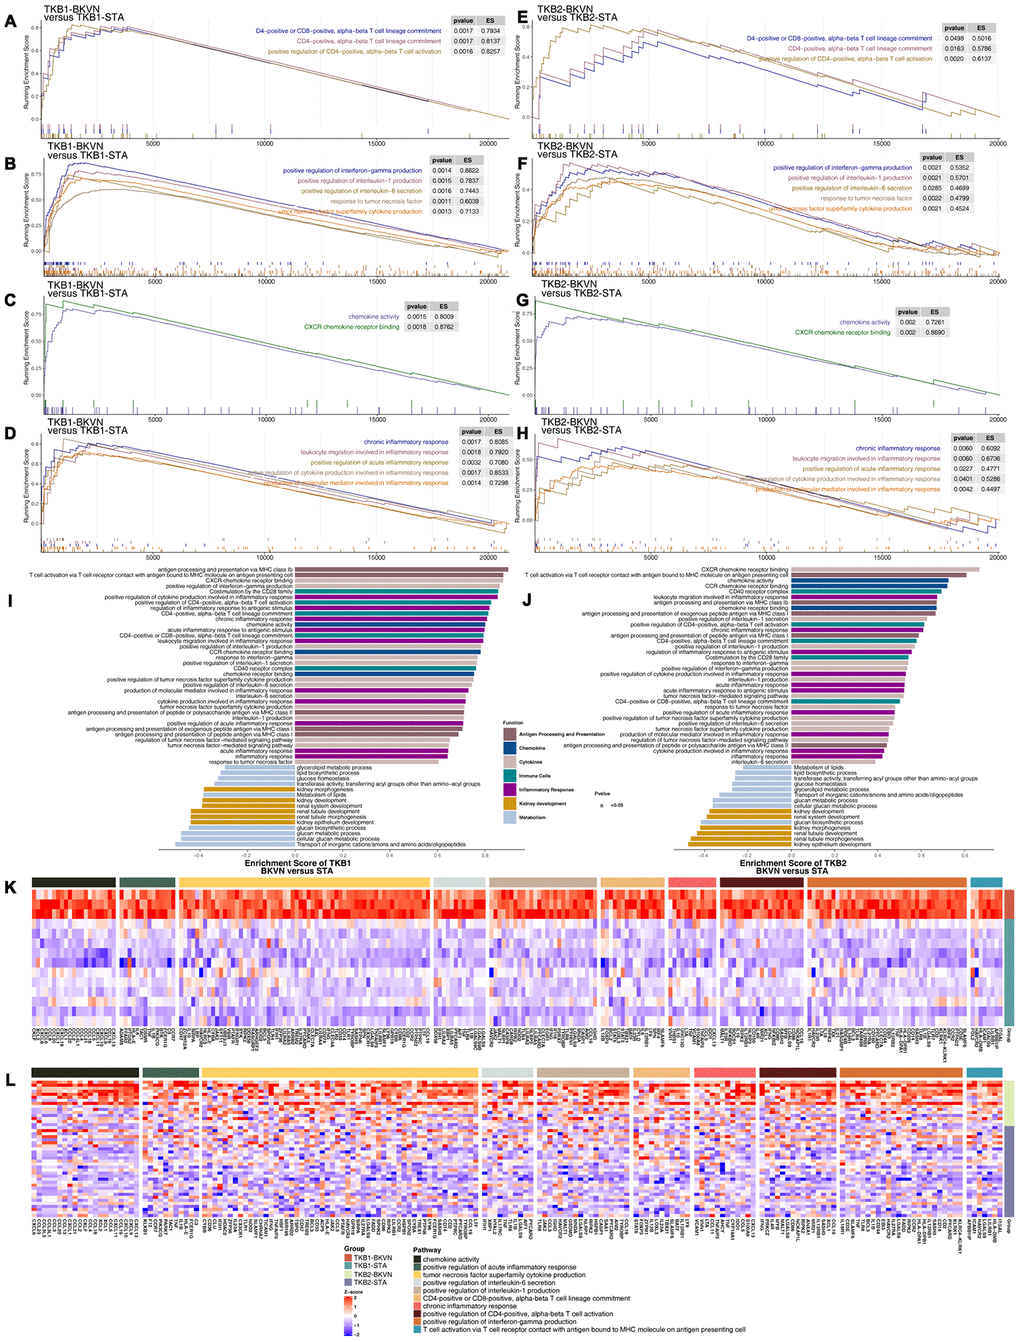
Figure 5.GSEA of hallmark gene sets in TKB-BKVN and TKB-STA data downloaded from MSigDB (GSE47199 and GSE75693). TKB1-BKVN was associated with activated immune cell- (A), cytokine- (B), chemokine- (C) and inflammation-related pathways (D). Similarly, TKB2-BKVN was associated with activated immune cell- (E), cytokine- (F), chemokine- (G) and inflammation-related pathways (H). All transcripts were ranked by the log2(fold change) between TKB-BKVN and TKB-STA. Each run was performed with 1,000 permutations. Differences in pathway activities scored by GSEA between TKB-BKVN and TKB-STA (I, J). Enrichment results with significant differences between TKB-BKVN and TKB-STA are shown. The functions of the pathways are shown in the annotations. (K) Heatmap of core genes in significantly enriched pathways between TKB1-BKVN and TKB1-STA. (L) Heatmap of core genes in significantly enriched pathways between TKB2-BKVN and TKB2-STA. In the heatmaps, blue means downregulation, while red means upregulation.