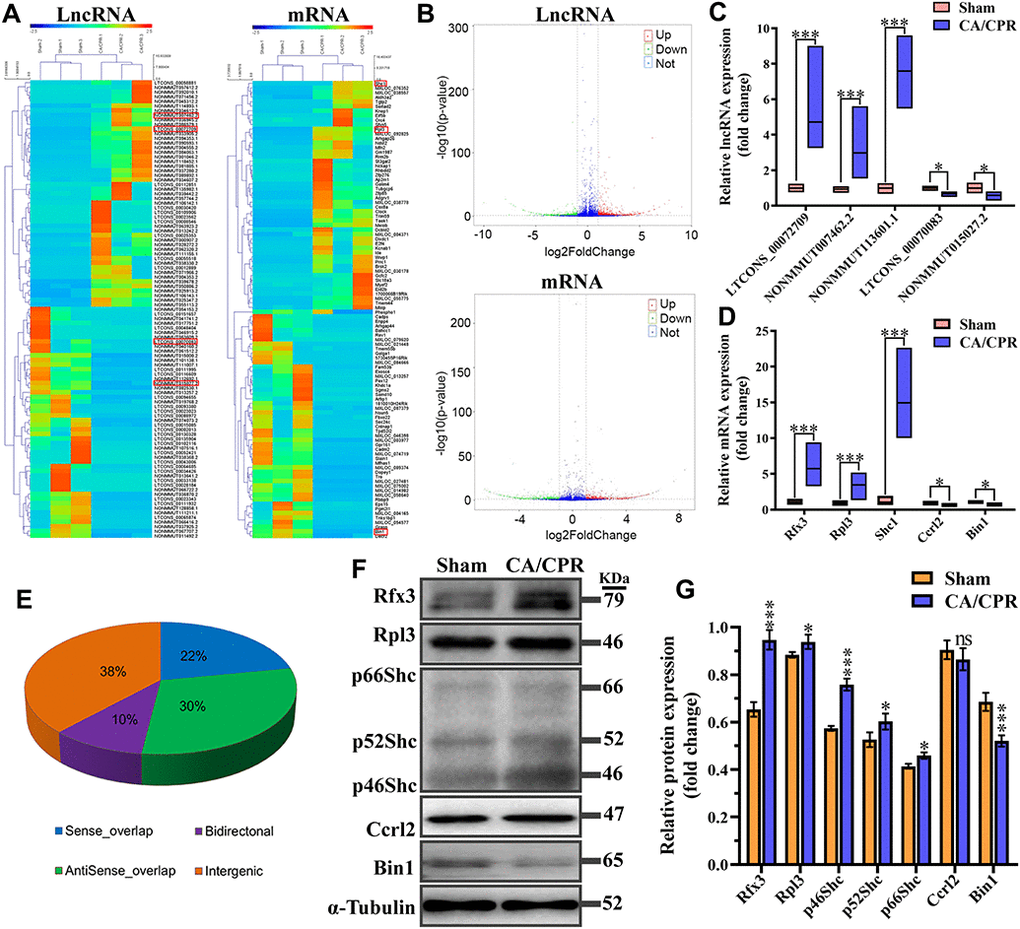
Figure 3.Expression profiles for lncRNA, mRNA, and encoding protein. (A) Hierarchical clustering of the expression data for lncRNA and mRNA. Each column represents one sample; rows indicate the 100 lncRNAs or mRNAs (50 overexpressed and 50 underexpressed in CA/CPR group). The relative expression of lncRNAs and mRNAs is displayed according to the color scale. Green and red denote downregulation and upregulation, respectively. (B) Volcano plots of the lncRNA and mRNA expression level. Up-regulated and down-regulated genes are indicated in red and green dots, respectively. Blue dots denote the same between the two groups. (C, D) Five pairs of dysregulated lncRNA (C) and mRNA (D) were validated through qRT-PCR in 10 pairs of CA/CPR and sham samples. (E) Subgroup analysis for lncRNAs with differentially expressed depending on genes location and the association with neighboring protein-encoding genes. *P < 0.05, ***P < 0.001. (F) Expression levels of mRNA encoded proteins were detected by western blot assay in the hippocampus of CA/CPR (right line) and sham (left line) models. (G) Quantitative analysis of expression levels of proteins using gray analysis of ImageJ. *P < 0.05, **P < 0.01, ***P < 0.001.