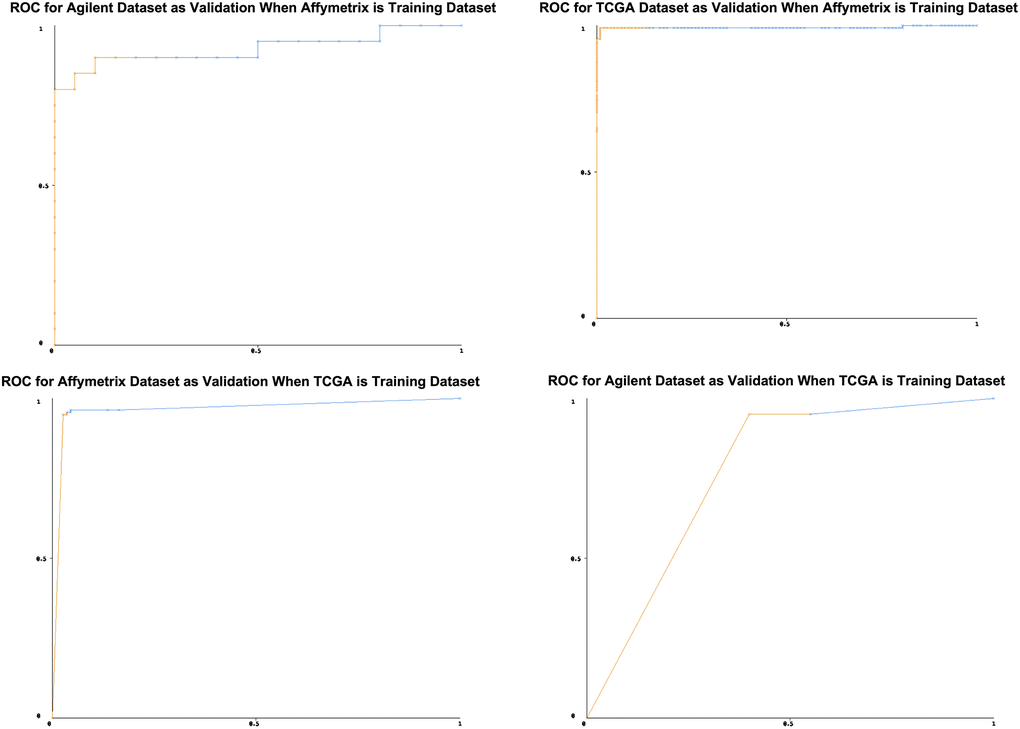
Figure 6.Receiver Operating Characteristic curves. The x-axis is the false positive rate, the y-axis is true positive rate. Since the curves are above the diagonal line, this represents good classification results. It means the prediction models can predict lung cancer precisely.